Not all LLMs are created equal. Some dominate in sheer numbers, while others quietly outperform expectations.
Our analysis of more than 2.3 million user sessions across leading LLMs reveals a nuanced picture of sessions, user engagement, and traffic efficiency.
While some of these platforms (like ChatGPT) are household names and command massive audiences, others are smaller, specialized, or emerging. But across the board, the patterns reveal surprising insight into how users engage with different AI platforms.
Our study dives into the details, showing that volume alone doesn’t indicate dominance and that engagement often depends on context, workflow, and the purpose behind the interaction.
Key Takeaways
- ChatGPT drives the most traffic, but has the lowest engagement of all the popular chatbots.
- Even with a lower session count, Claude drives the most engaged visitors across AI platforms.
- Use-case–dependent platforms, like Perplexity and Copilot, drive higher-quality traffic and more meaningful user interactions.
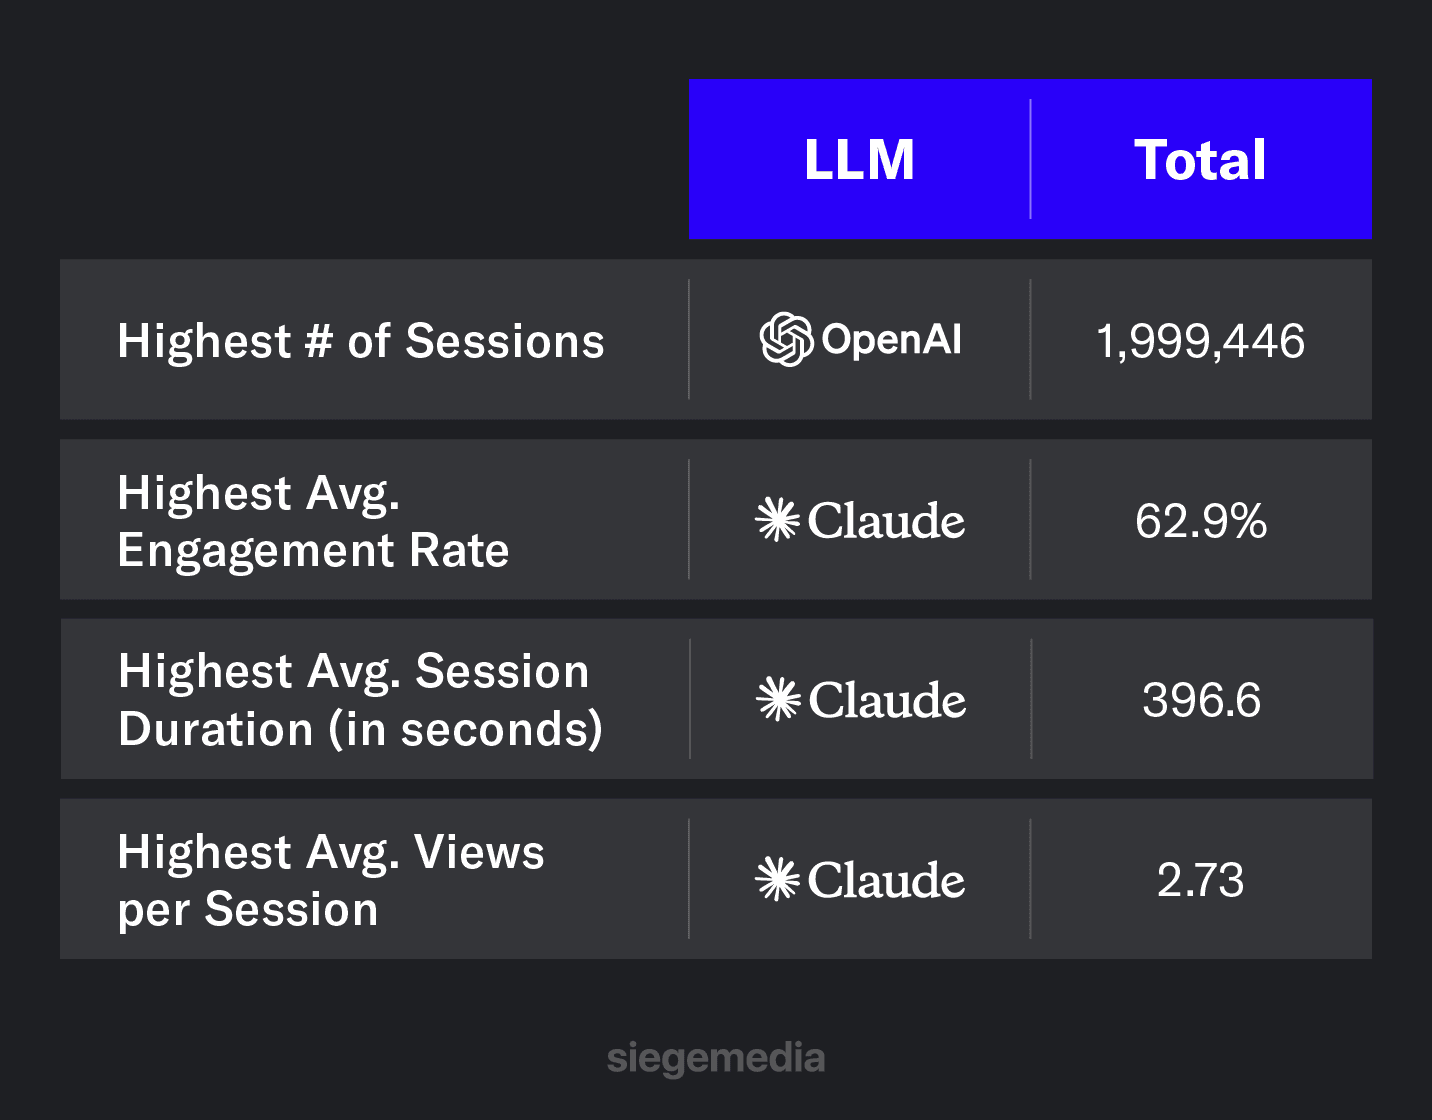
| LLM | Total Sessions | Avg. Engagement Rate | Avg. Session Duration (in seconds) | Avg. Views per Session |
|---|---|---|---|---|
| ChatGPT | 1,999,446 | 58.5% | 320.27 | 2.59 |
| Perplexity | 229,289 | 58.3% | 270.2 | 2.24 |
| Gemini | 76,672 | 58.1% | 338.8 | 2.29 |
| Microsoft Copilot | 62,761 | 62.8% | 349.2 | 2.42 |
| Claude | 12,750 | 62.9% | 396.6 | 2.73 |
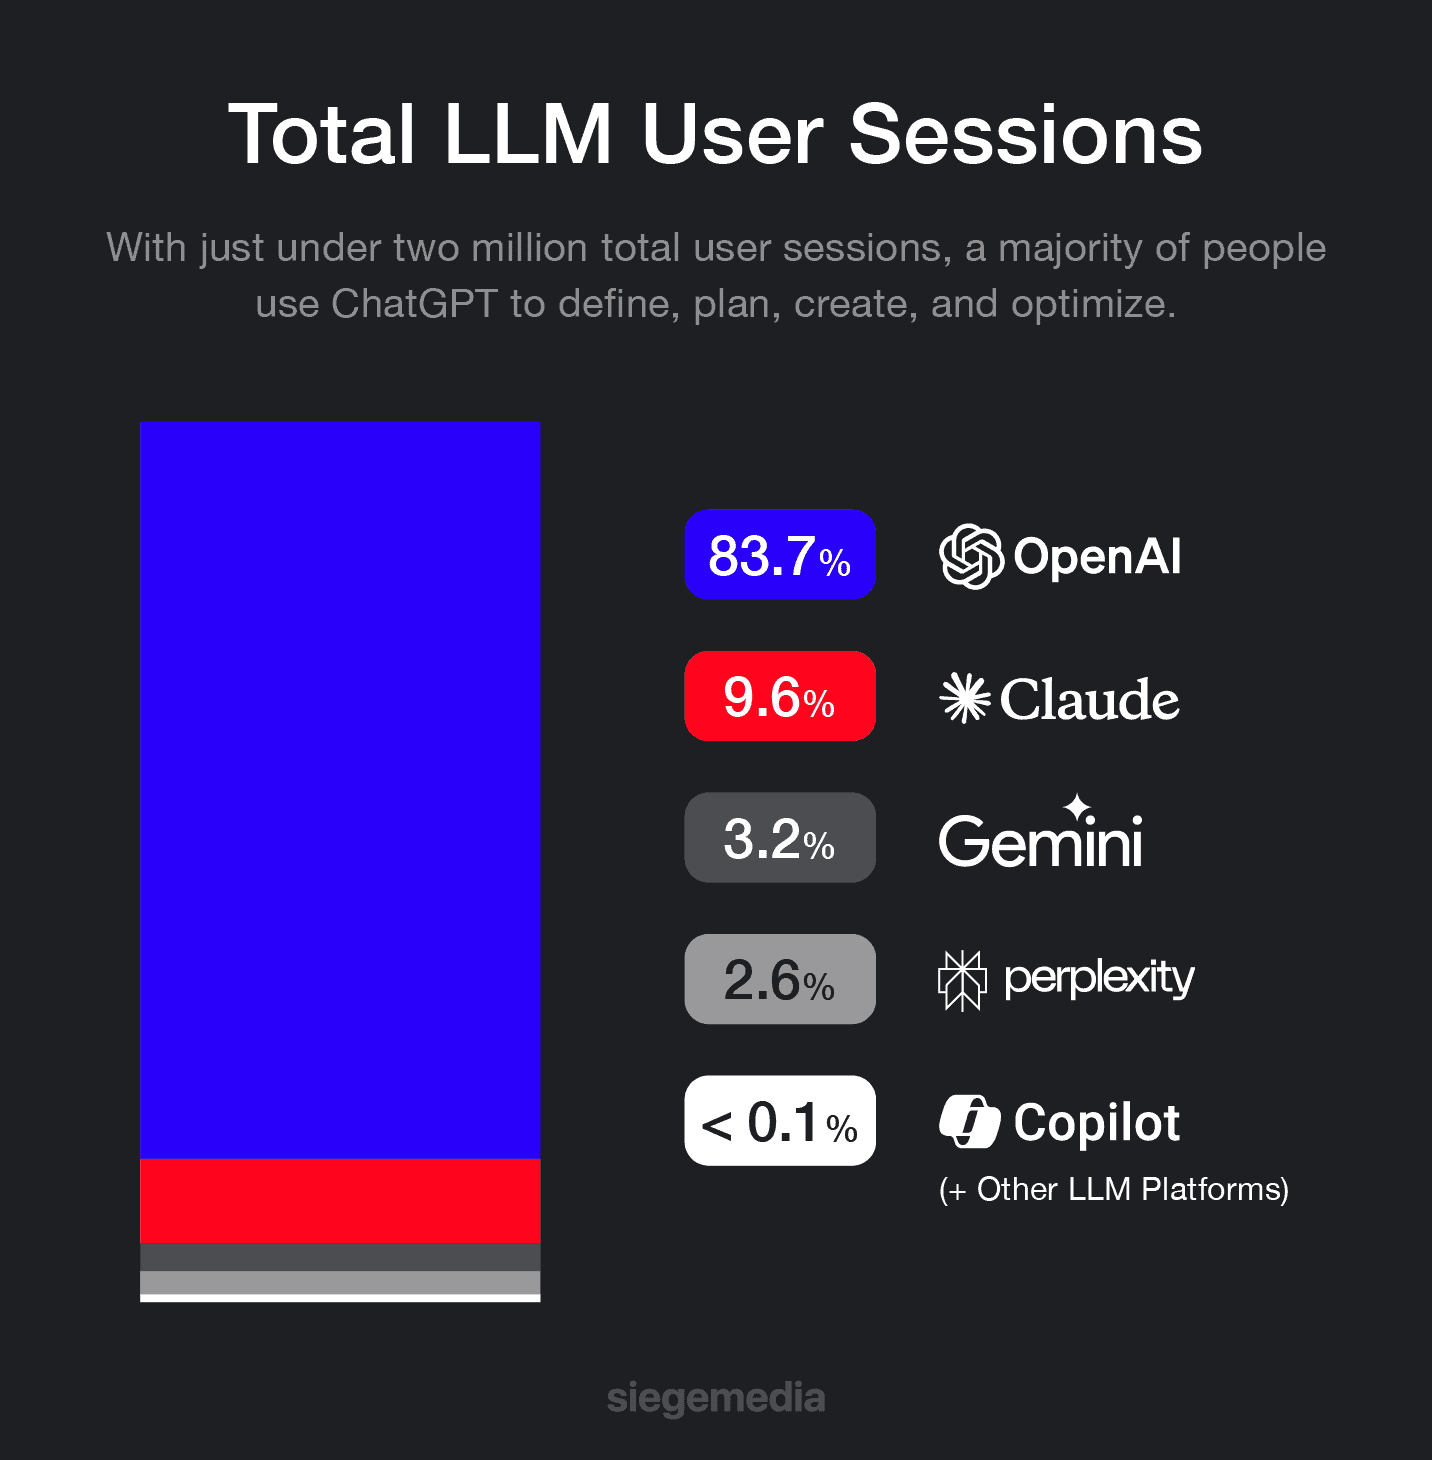
ChatGPT Dominates More Than 83% of Sessions…
| LLM | Total Sessions |
|---|---|
| ChatGPT | 1,999,446 |
| Perplexity | 229,289 |
| Gemini | 76,672 |
| Microsoft Copilot | 62,761 |
| Claude | 12,750 |
As a surprise to (almost) no one, ChatGPT accounts for more than 83% of the total recorded activity across LLMs. With just under two million total user sessions, a majority of people use ChatGPT to define, plan, create, and optimize everything from personal itineraries to emails.
Additionally, while ChatGPT consistently drives five to 10x more sessions than other LLMs across properties, it also shows high views per session and session duration on content- and research-heavy sites.
However, despite this overall dominance, ChatGPT’s engagement rate is 58.5%, which is below average. This may suggest broad adoption but shallow usage patterns, leaving ownership opportunities for additional metrics open to other LLMs.
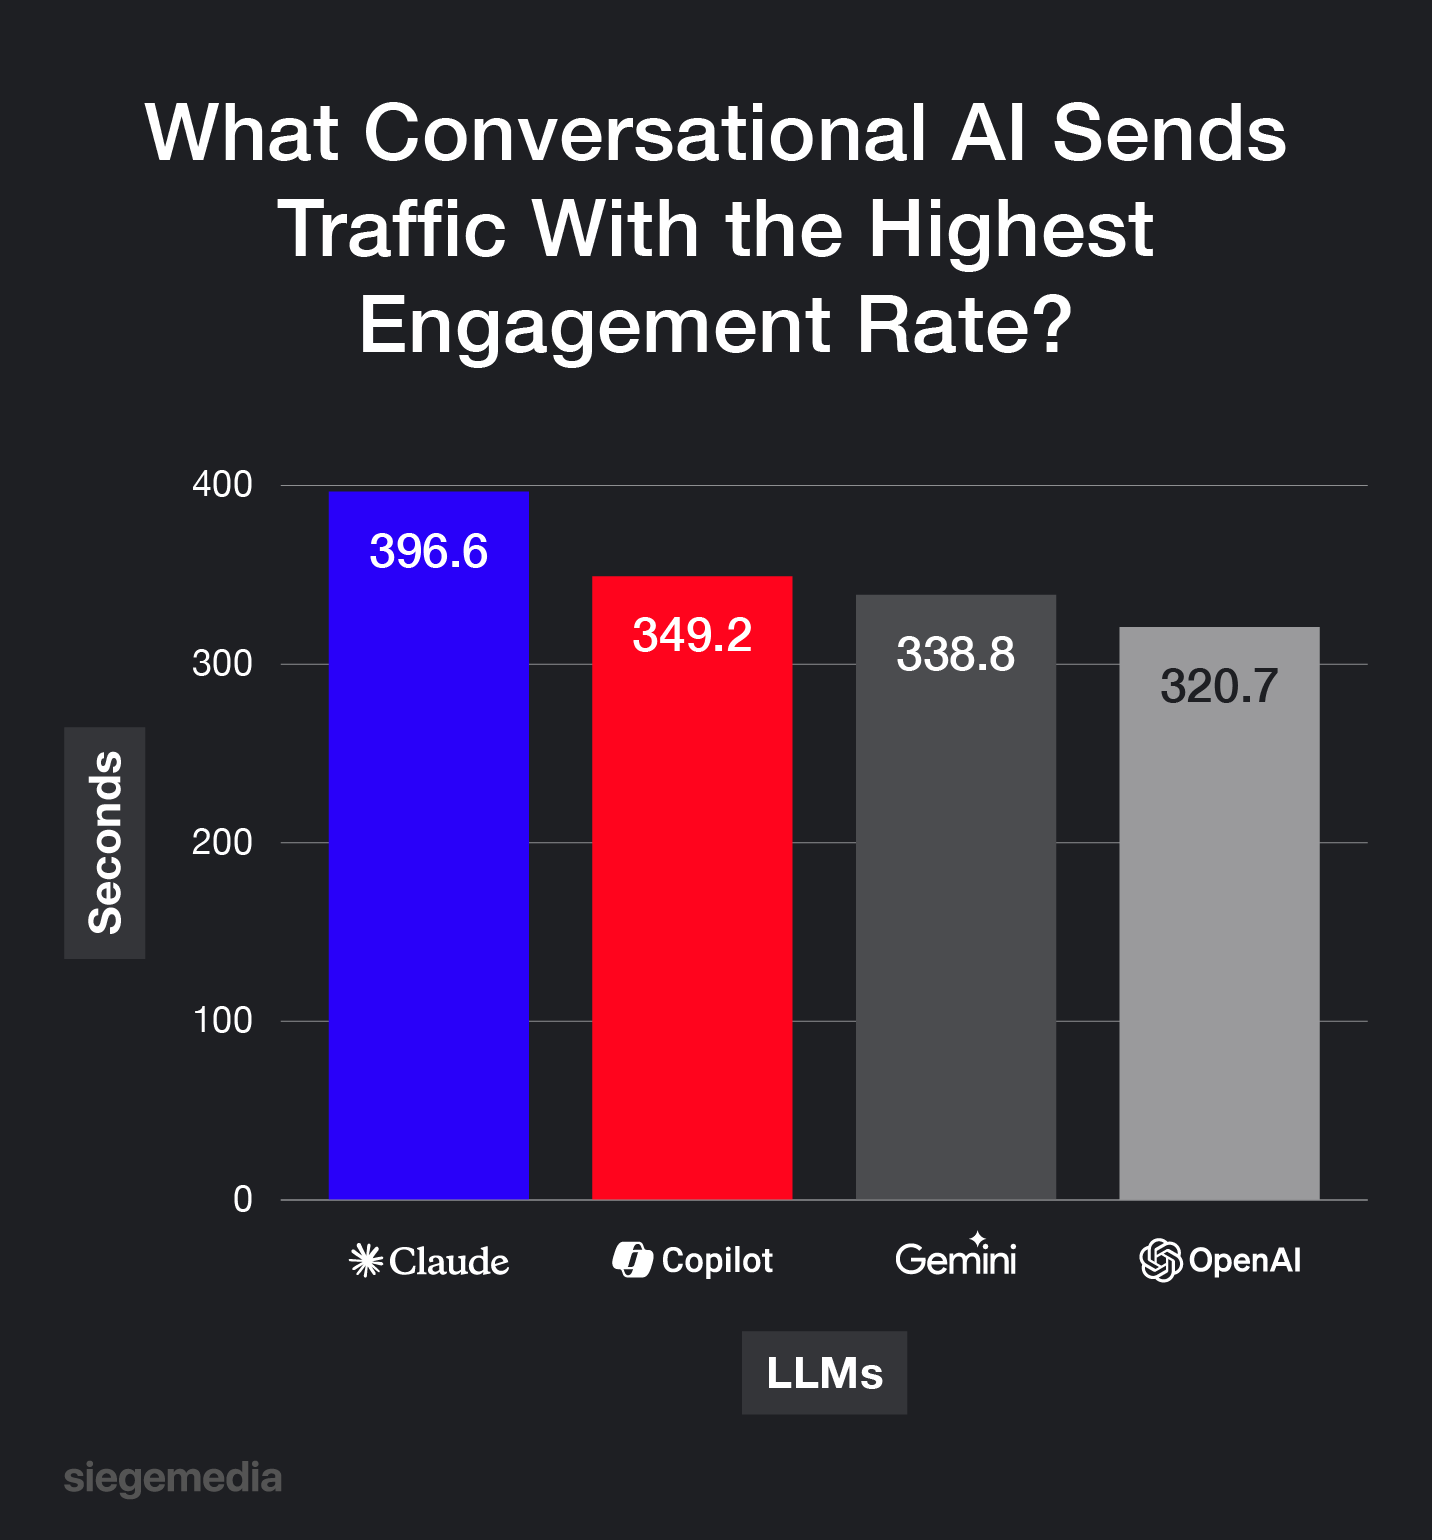
…But Session Duration Is Owned by Other LLMs
| LLM | Avg. Session Duration (in seconds) | Avg. Views per Session |
|---|---|---|
| ChatGPT | 320.27 | 2.59 |
| Perplexity | 270.2 | 2.24 |
| Gemini | 338.8 | 2.29 |
| Microsoft Copilot | 349.2 | 2.42 |
| Claude | 396.6 | 2.73 |
While our other LLMs fall behind in total sessions, their session durations often outpace or are comparable to those of ChatGPT.
Despite its smaller user base across our properties, Claude users spend more than 396 seconds (or six and a half minutes) on a single session and view around 2.73 pages per session, completing more complex tasks or exploring more within the tool.
Microsoft Copilot follows closely behind Claude due to its integration with existing tools, like Microsoft 365. Copilot users spend approximately 349 seconds per session (on average), showcasing strong retention and productivity.
| Note: Given Claude’s size and growing popularity, our data on the site’s total sessions is potentially lower across our properties than for other LLMs, meaning its overall session count in this dataset may not fully reflect its broader market activity. |
|---|
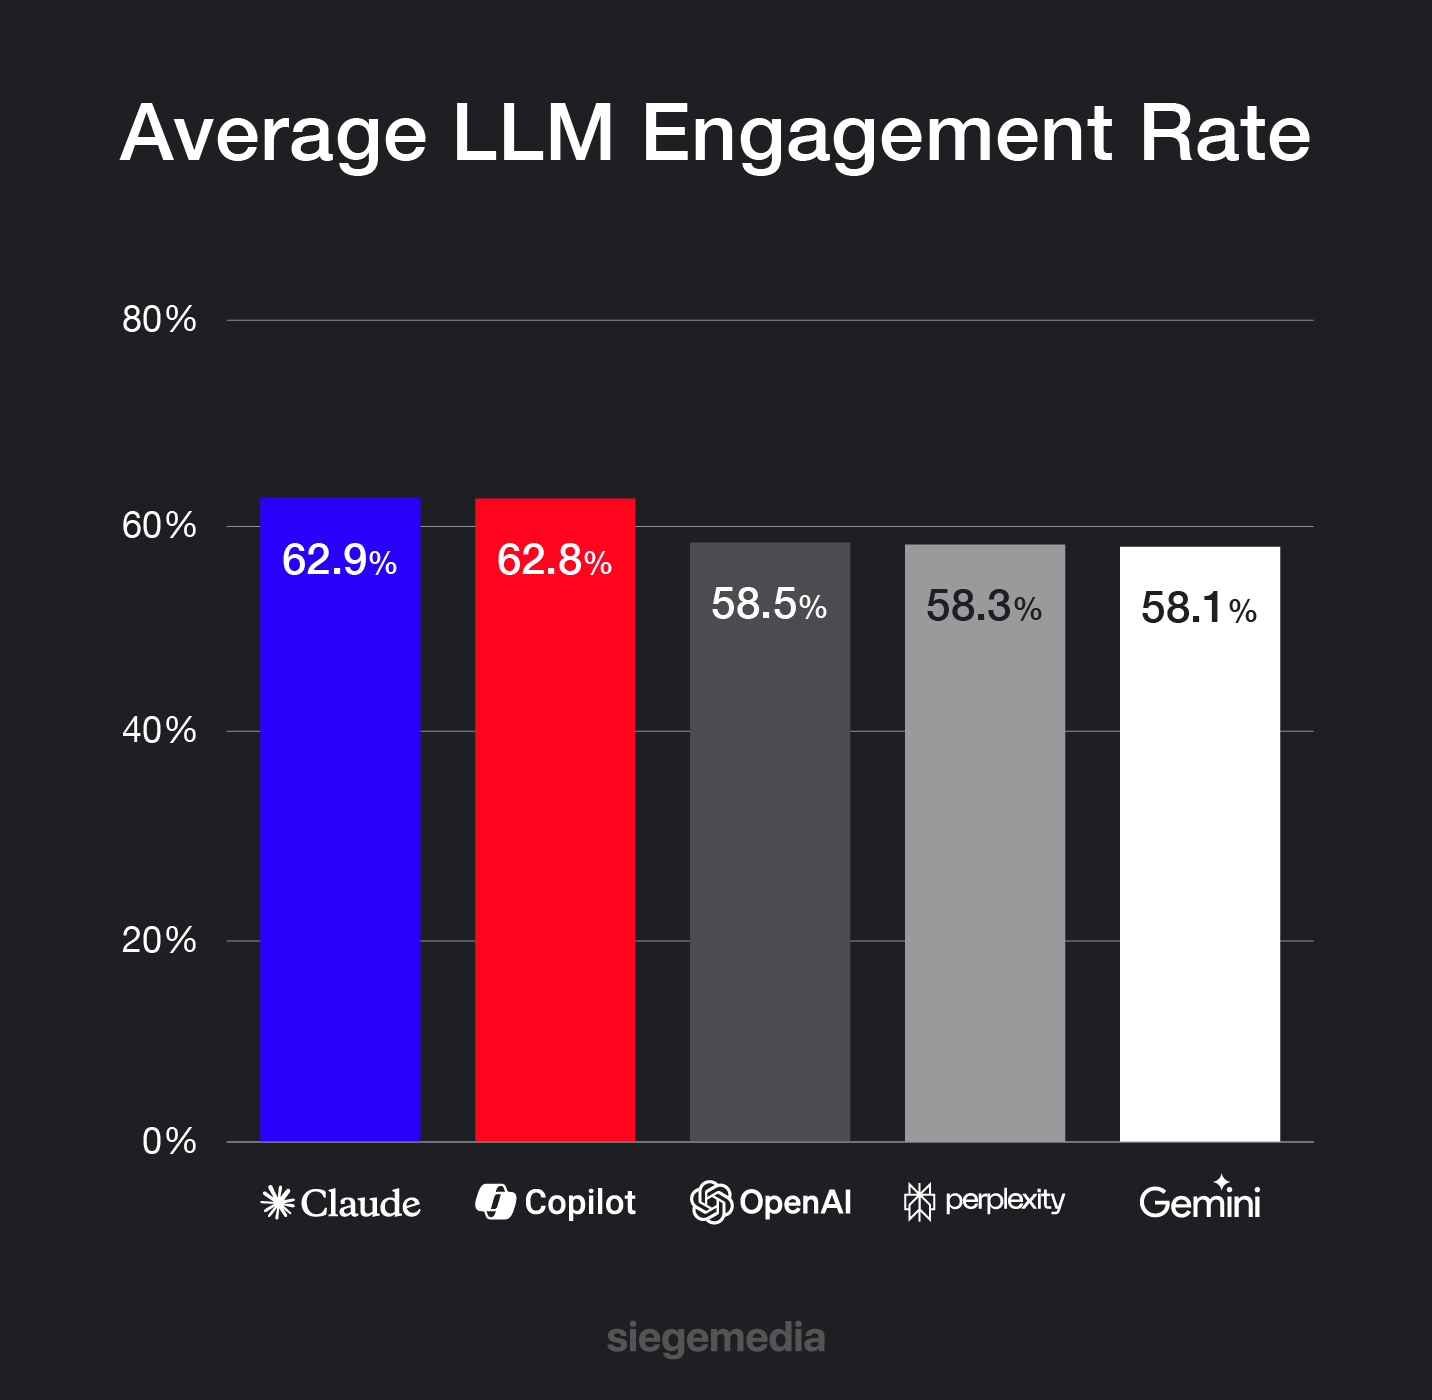
User Engagement Is Highest on Use-Case–Dependent Platforms
| LLM | Avg. Engagement Rate |
|---|---|
| ChatGPT | 58.5% |
| Perplexity | 58.3% |
| Gemini | 58.1% |
| Microsoft Copilot | 62.8% |
| Claude | 62.9% |
LLMs tied to specific workflows or ecosystems drive the deepest engagement, even with lower total session volumes. For example:
- Gemini records a high average session duration, suggesting deep but niche adoption with users likely exploring Gemini as part of Google’s broader ecosystem rather than returning habitually.
- Perplexity supports strong session totals but lower average views per session, pointing to fast, single-query interactions typical of search-like behavior.
- Microsoft Copilot stands out for its consistent engagement across professional and enterprise-focused sites, supported by its Microsoft 365 integration.
These trends highlight that LLMs embedded into professional or ecosystem-specific workflows drive the most meaningful engagement, even if they don’t command the largest share of total sessions.
Plus, Copilot showed notable volume growth between May and September 2025, signaling a potential rise in the adoption of context- or ecosystem-specific AI tools within business contexts.
Consider: Additional Engagement Findings
Smaller platforms, like Poe and Meta AI, represent only a fraction of total sessions, and their engagement patterns set them apart as outliers. Poe’s engagement rate was the highest in our dataset at 63%, which could suggest that users find it highly interactive and purpose-driven.
Similarly, though Meta AI’s total session volume is nearly negligible, it records the highest engagement and views per session, indicating a small but deeply invested user base.
However, across these niche tools, sessions tend to be polarized: either highly productive and sustained or brief and non-engaged, reflecting the variability typical of emerging, experimental LLM platforms.
| Key takeaway: For users and organizations exploring LLM adoption, remember that engagement patterns can vary widely depending on platform maturity, use case focus, and audience size. High engagement does not always correlate with broad adoption. |
|---|
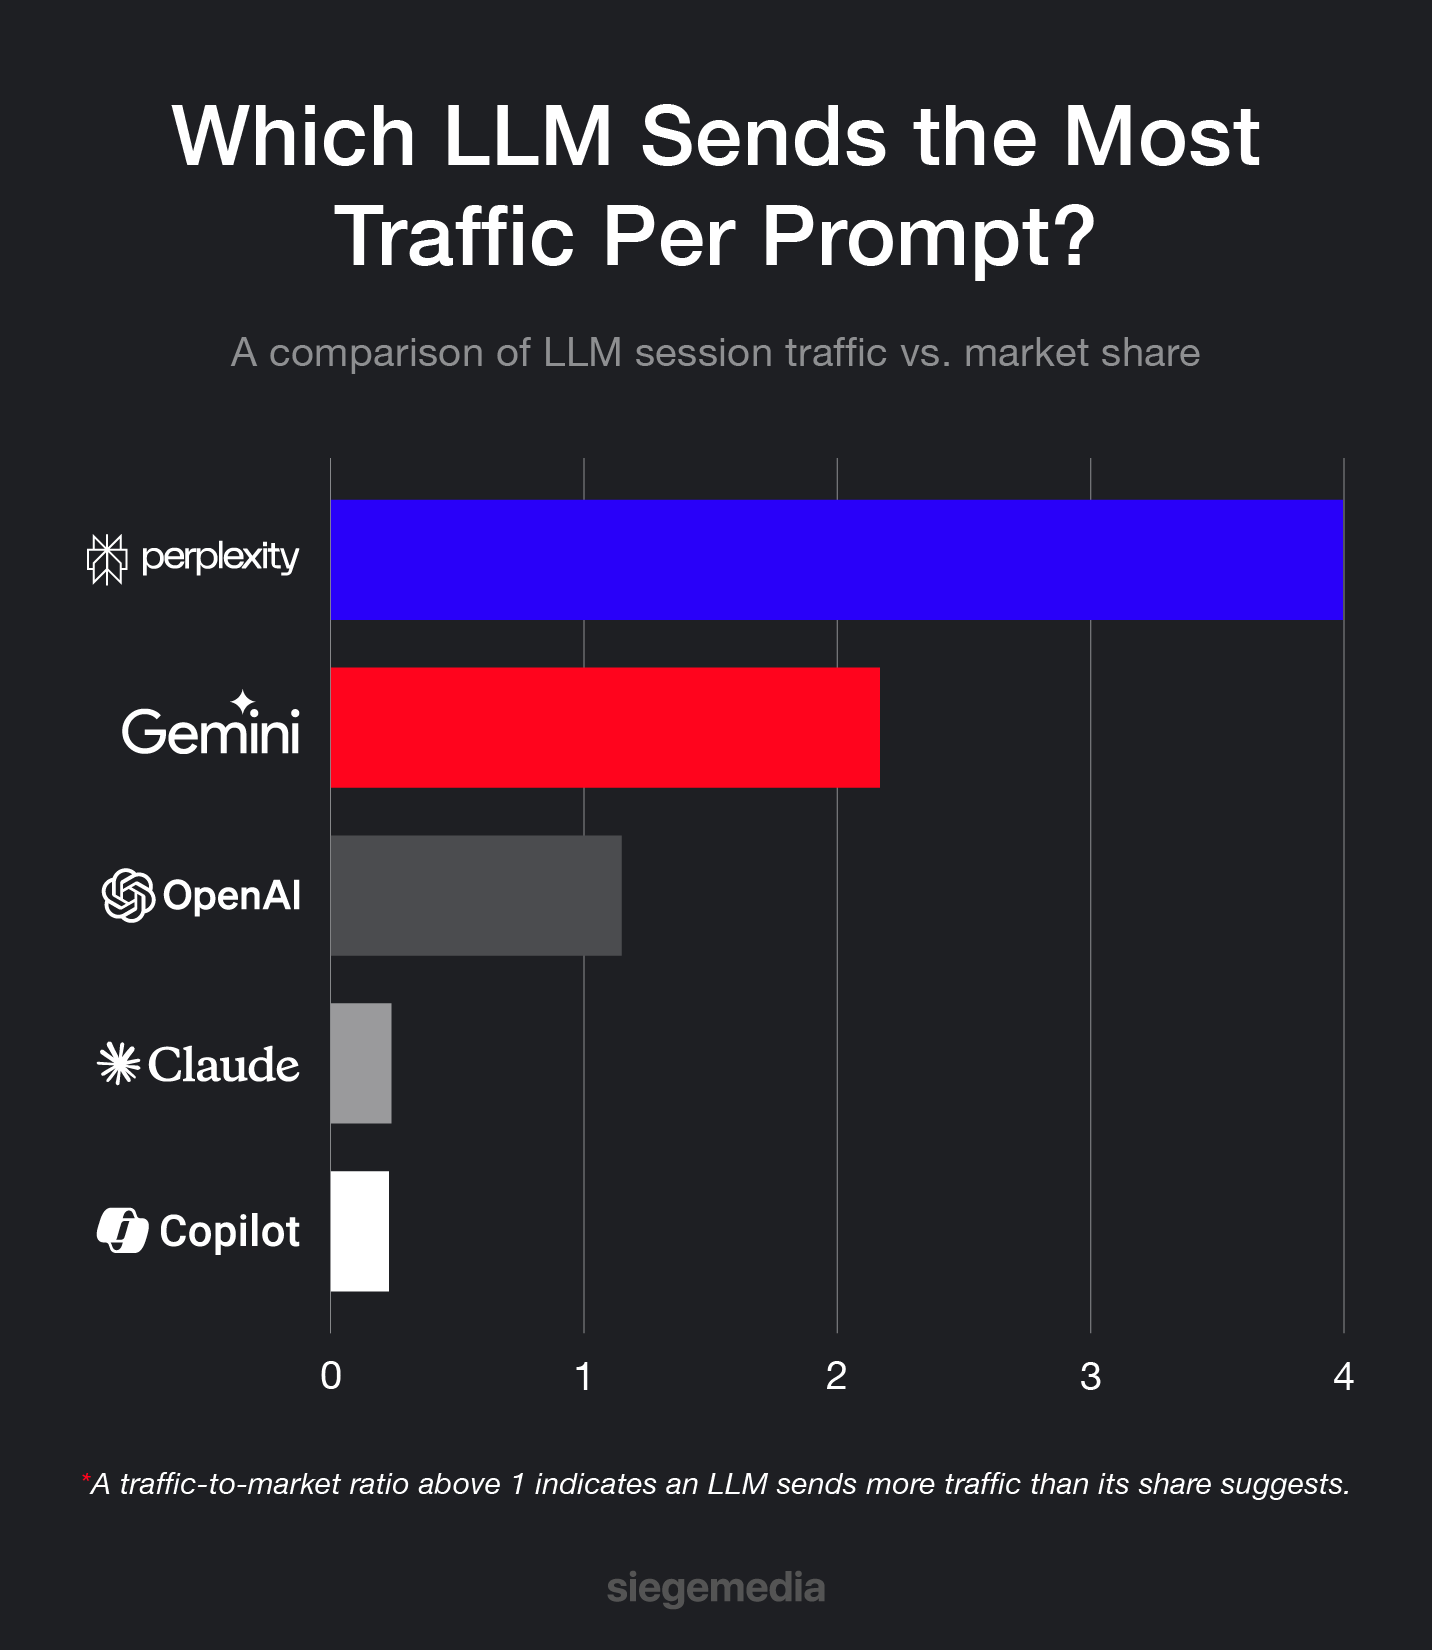
Perplexity Sends the Most Traffic per Prompt
| LLM | Traffic Share %* | Market Share % | Ratio |
|---|---|---|---|
| Perplexity | 9.6% | 2.4% | 4.00 |
| Gemini | 3.2% | 13.3% | 2.17 |
| ChatGPT | 83.7% | 72.9% | 1.15 |
| Claude | 0.5% | 2.2% | 0.24 |
| Microsoft Copilot | 2.6% | 1.2% | 0.23 |
*Traffic share percentages have been sourced from Similarweb.
While ChatGPT dominates total sessions, Perplexity stands out as the most traffic-efficient LLM. According to Similarweb, Perplexity only accounts for 2.4% of the total market share, but our dataset shows that the platform generates 9.6% of all session traffic. This indicates that it drives 4× more traffic per session than its market share would suggest.
By contrast, ChatGPT’s traffic-to-market share ratio (1.15) aligns closely with its usage, while Gemini (0.24) and Claude (0.23) underperform, demonstrating that high overall usage does not necessarily translate into proportional traffic contribution.
Our results suggest that niche or use case-dependent platforms can punch above their weight, attracting smaller audiences that are highly active and capable of generating outsized traffic.
| Tip: If you’re evaluating LLM adoption, consider both volume and per-session impact, not just total sessions. |
|---|
AI Search: Perplexity vs. Google
With AI search on the rise, let’s compare the numbers for Perplexity (an AI search engine) and Google (a traditional search engine):
| LLM | Total Sessions | Avg. Engagement Rate | Avg. Session Duration (in seconds) | Avg. Views per Session |
|---|---|---|---|---|
| 2.1 billion | 56.8% | 273 | 2.71 | |
| Perplexity | 229,289 | 58.3% | 270.2 | 2.24 |
Google massively outpaces Perplexity in traffic with more than two billion total sessions, but let’s not forget that Google’s search engine launched in 1998 while Perplexity’s engine went live in 2022.
Even with more than 20 years of growth and popularity between the two, Perplexity’s average engagement rate (58.3%) is slightly higher than Google’s. This suggests that while Google dominates in scale, Perplexity’s smaller but dedicated user base may interact more deeply per visit.
However, the near-identical average session durations suggest that both platforms sustain user attention equally well once a session begins.
In other words, Google wins on volume, but Perplexity’s comparable engagement metrics highlight the growing traction of AI-native search. Its ability to drive a similar depth of interaction with a fraction of Google’s audience could point to a meaningful shift in how users explore information online.
| Key Takeaway: Considering a hybrid approach for ranking in AI search engines and across traditional results pages is a new and improved way to future-proof content strategy. |
|---|
Prioritize User Experiences Across All LLMs
It’s no surprise that ChatGPT owns the highest share of sessions across LLMs, but that’s not the whole story.
The engagement metrics behind user-, use case-, and ecosystem-specific platforms, like Perplexity, Copilot, and Gemini, show that they’re capable of driving deeper engagement and outsized traffic shares.
While being cited across a major LLM like ChatGPT is great for visibility, the best strategies consider the needs, users, and data being cited across all LLMs. With a hybrid content strategy that combines organic search with AI optimization and generative engine optimization (GEO), we can help you thrive in the new era of search.
Reach out to Siege Media, and we’ll help you create something amazing.
Our Methodology
Siege Media conducted this study using analytics data obtained from 2,389,220 user sessions across multiple LLM platforms, including ChatGPT, Perplexity, Gemini, Microsoft Copilot, Claude, Poe, and Meta AI. Session data represents user activity on each platform and was collected with permission from participating properties between September 2024 and September 2025.
Traffic share data was sourced from Similarweb (2025). Sessions were used as a proxy for visits, with each session representing a single period of user activity on the LLM platform. The traffic-to-market share ratios presented in this report reflect the relative amount of outbound traffic generated per session, highlighting which platforms send more traffic relative to their overall market share.