We’ve been running a series of internal benchmarks at Siege to figure out which content templates actually move the needle in 2026. Pricing pages, calculators, alternatives content, cost questions, editorial sections.
The original brief was performance in Google. But midway through the work, a question started showing up in every client meeting: what comparison content impacts AI search traffic the most?
So we ran a different cut of the data.
We took 116 B2B GA4 website properties, pulled the volume of “transactional” comparison content each site had built (anything matching vs, alternative, or best-X-software in the URL) and correlated it against AI search-referred sessions over the trailing 90 days.
AI search here means ChatGPT, Perplexity, Claude, Gemini, Copilot, and Meta AI combined. Across 1,112 transactional pages, one finding came back louder than anything else.
The single strongest content predictor of AI search traffic is versus (VS) pages. Not alternatives. Not best-software listicles. Comparison-style “X vs Y” content out-correlated every other transactional template by a wide margin, and consistently across every AI source we measured.
Below is what the data actually says, and what to do about it.
The Shape of AI Search Today (for B2B)
Before getting to the findings, a baseline on what AI search referrals actually look like in 2026. Across all 116 B2B properties over the trailing 90 days, AI search referred 739,492 total sessions. The source mix:
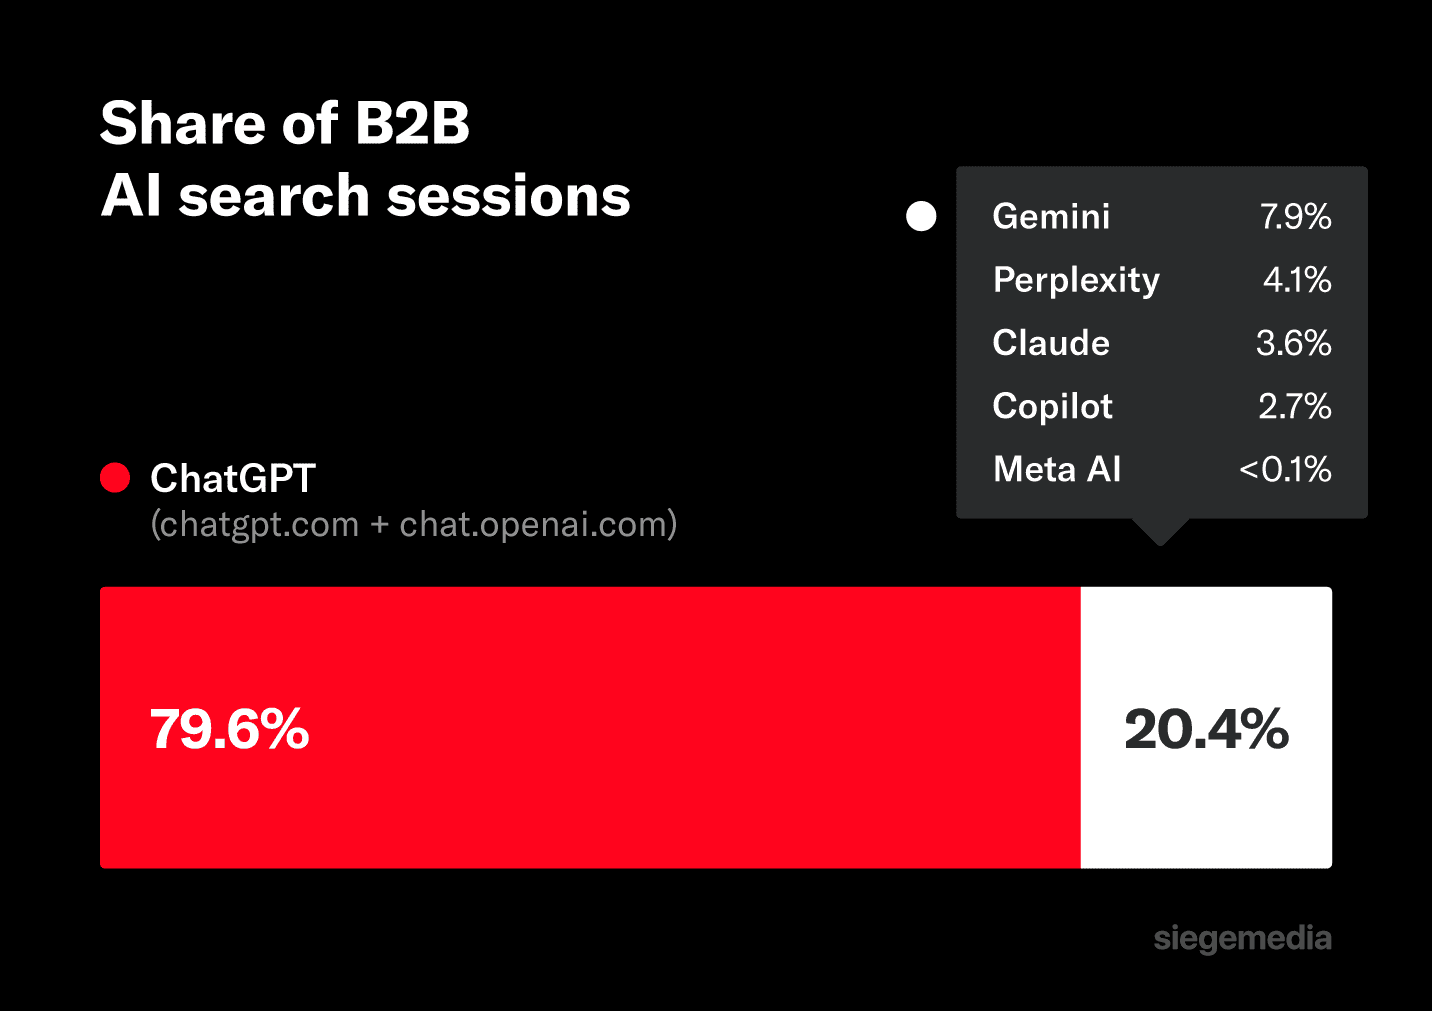
ChatGPT dominates the channel from a referral point of view. Optimizing for AI search in B2B today is mostly a story about ChatGPT, with five other sources adding ~20% more volume on top.
Claude is sharply rising in usage and showing up more and more in self attribution, but it’s at very least lagging significantly from a referral point of view in the past 90 days.
That’s important context for the rest of the post: the findings hold across all six sources, but most of the traffic moves with ChatGPT.
The Headline: Vs Pages Are the Strongest Signal
We tested three comparison content types against AI search-referred sessions.
The Spearman rank correlation, basically, “how reliably does ranking sites by this metric also rank them by AI search traffic”, came out like this:
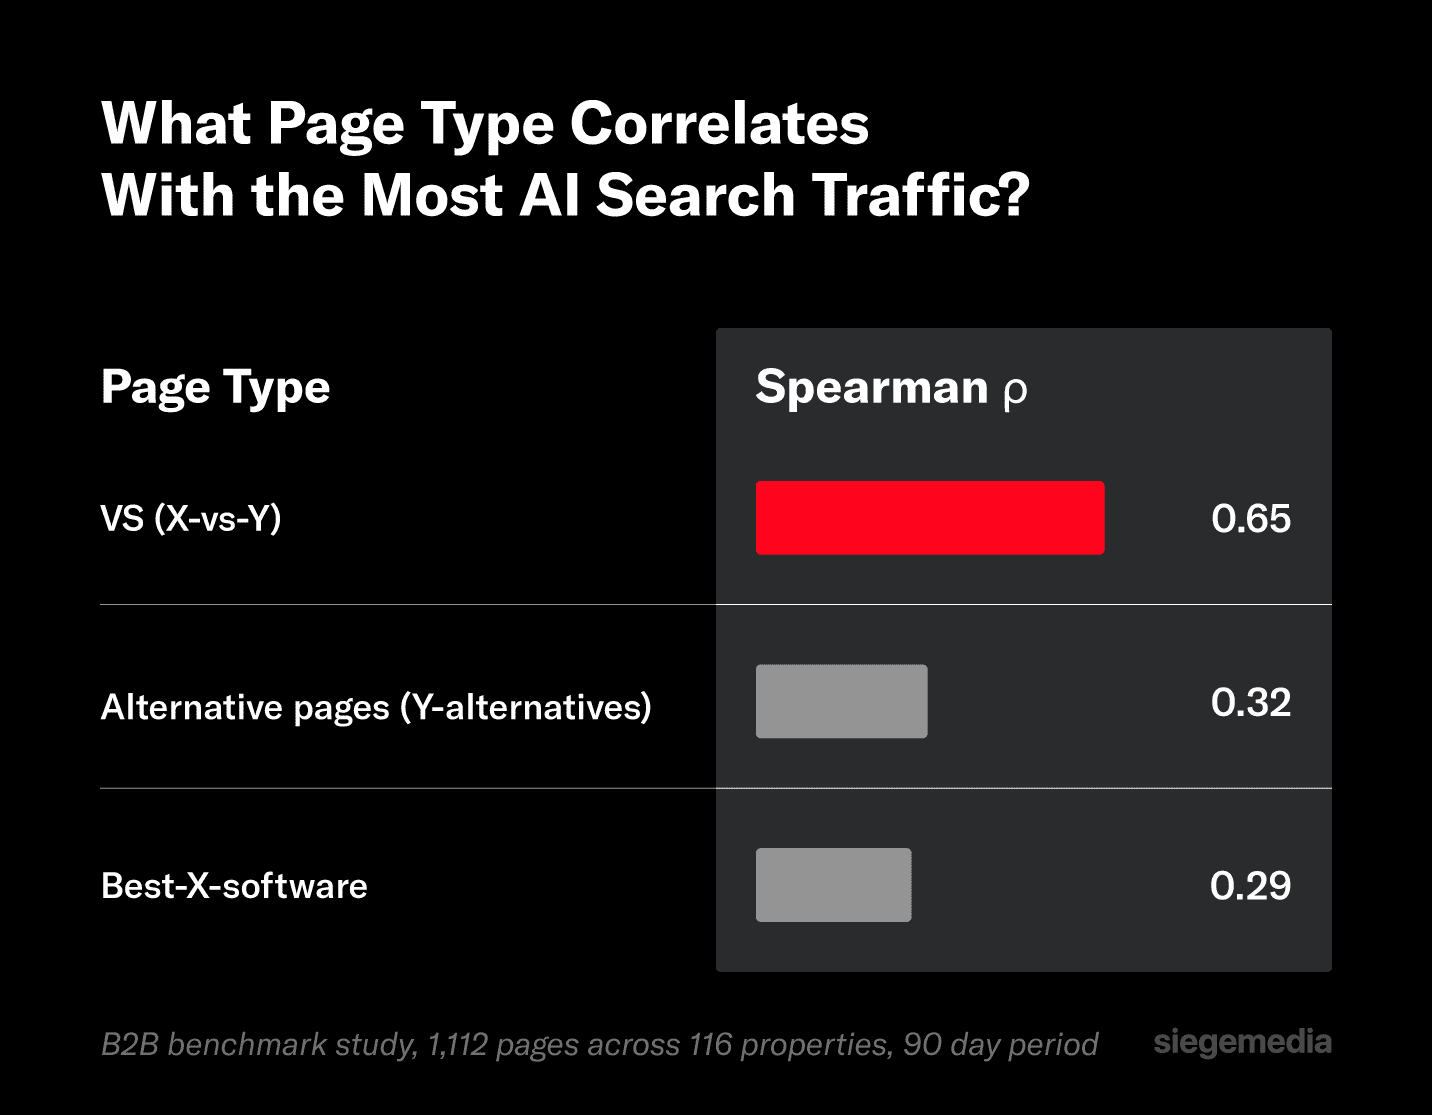
Versus pages were double the next-best content type. That’s not a marginal lead.
It’s the kind of gap where, if you forced us to pick one type of comparison content to build today, the data wouldn’t even let us argue about it.
The likely reason is structural. When an LLM formulates an answer to a comparison query, it tends to cite pages that already exist at the exact “X vs Y” intent — pages that match the question shape.
Alternative and “Best X software” content competes directly with G2, competitor and Capterra affiliate listicles for the same citation slot.
Versus pages have less competition for AI citation graphs and more direct intent match.
If you can only build one type of transactional comparison content for AI referral traffic, the data says to build versus pages.
The Volume Effect: The First 20 Pages Move the Needle
Beyond the page-type question, we wanted to know whether the amount of transactional content on a site mattered. So we bucketed our 116 B2B sites by total transactional page count and looked at the median AI search sessions in each bucket.
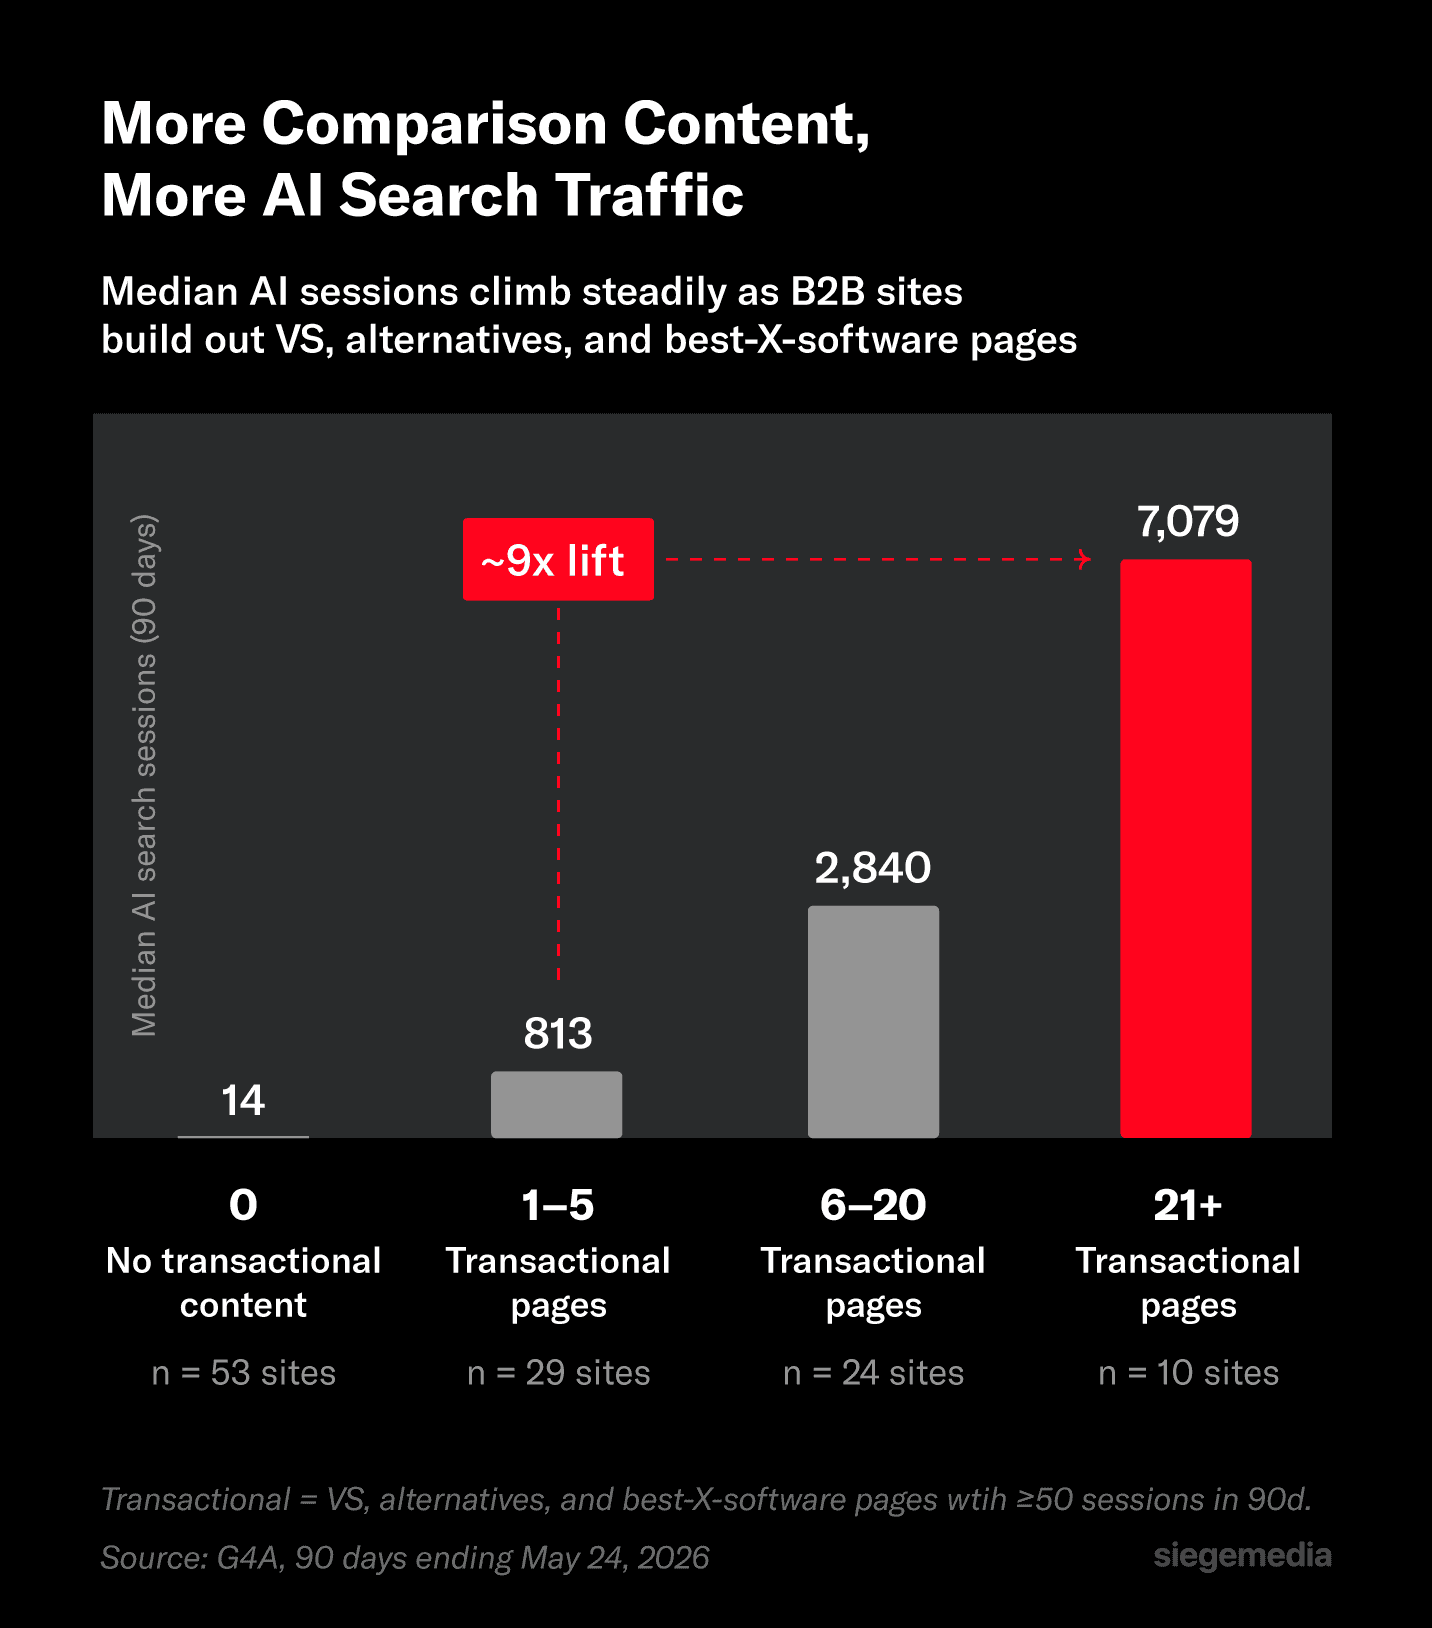
The curve climbs steadily through every bucket. From one to five pages to six to 20 is a 350% jump in median AI traffic. From six to twenty to 21+ is another 250%.
End-to-end, B2B sites with 21+ comparison pages have 900% more median AI search sessions compared to B2B sites with one to five.
The first 20 pages are where the curve bends most sharply, past that, additional pages keep adding lift but the per-page return diminishes.
For a company choosing whether to commit to a comparison content program: the early returns are real. You don’t need to commit to 100 pages to see lift.
Going from five pages to 20 multiplies the median by 350%.
Exciting Results for “Best X Software” Opposers
Many areas of our industry have come out against “best X software” roundups done by first parties. Because they’ve worked so well and contributed to performance snowballs of being mentioned elsewhere, we’ve always recommended doing them within reason for our clients when we see them frequently in source URLs.
This said, what we did not expect from this study is that these pages would actually have the lowest correlation (but still be positive) in our study. What this means is the prioritization story has flipped.
While we have always recommended doing versus content, it now becomes first in our priority list.
These direct comparisons tend to get less internal opposition for “weirdness”, although are still contentious in their own right due to the combative nature of the content.
From there, alternative content being slightly higher also thematically fits the story. It’s reasonable for every company to call themselves an alternative, even if they aren’t explicitly yelling from the stands that they are the best. For this reason, “X vs Y” and “Y alternatives” content should not ever feel strange on a B2B website.
What We Found With Pricing Pages — and Why We Excluded Them
We originally tested four content types: versus pages, alternatives, best-X-software, and pricing pages. The headline number on pricing looked striking: sites with a pricing page pulled a median 2,904 AI sessions versus 136 for sites without, about a 21x gap.
But the gap turned out to be misleading.
When we controlled for the broader content investment on each site, the pricing effect mostly disappeared. In the middle bucket of comparison-content volume (six to 20 pages), sites without a pricing page actually outperformed sites with one. In the top bucket, the two groups converged.
The result:
91% of sites that publish a pricing page also have versus pages.
Only 37% of sites that hide pricing have versus pages.
“Has a pricing page” turned out to be a proxy for “has built a comparison content program at all,” not an independent driver of AI traffic.
The cleaner read on the data is that versus, alternatives, and best-X-software — the three editorial comparison templates — are what AI search engines actually cite.
Our takeaway was that the pricing page is conversion infrastructure that some sites publish and some hide based on sales motion. Due to that, AI search engines treat the output accordingly.
Caveat: Content Isn’t the Whole Story
Before treating this as a guaranteed playbook, the honest read on the data is that content explains about a third of the variation in AI search traffic between B2B sites.
Put another way: if all you knew about a B2B site was how much transactional content it had built, you could predict about 28% of its AI search traffic from that alone. The other ~72% comes from brand pull, category fit, and citation graph density.
The clearest evidence: of the top 20 B2B sites in our dataset by AI search traffic, four of them, or about one in five, have fewer than five transactional pages.
Some of the top-traffic sites we measured got there with almost no transactional content at all. Brand authority on a category SERP can do the work that content would otherwise need to do.
Two takeaways from that:
One: for challenger brands without category authority, content is the lever they can actually pull. Building 20-50 transactional pages is something a team can execute against. Building 20 years of brand recognition in your category is not.
Two: for established brands with category authority, content compounds on top of it. Brand pull and content volume aren’t substitutes. The sites in our dataset that have both — significant transactional libraries and established category authority — consistently sit in or near the top bucket of AI search traffic.
The pitch to your CMO shouldn’t be “build versus pages and you’ll get more AI search traffic.” It should be “the floor moves up when you build versus pages, and brand and category fit determine your ceiling.”
A Note on Multi-Locale Programs
A second-order finding that stood out: sites with massive multi-locale libraries underperform their page volume.
The site with the most transactional pages in our dataset (several hundred), pulled fewer AI search sessions than another site with only 13 transactional pages concentrated on a single canonical locale. The pattern repeats across the dataset: heavy multi-locale programs sit below their page count would predict.
The likely explanation is that these pages are competing for much smaller search volumes than their U.S. counterparts, and also that AI search is less adopted in these countries as well.
A counterfactual to this analysis comes from separate analysis we’ve recently done emphasizing alternative content. Alternatives posts internationally actually drive much higher engagement rates than their U.S. counterparts. Engagement rates jumped 20-55 percentage points within less competitive regions.
In short, these pages may balance out in priority, and still be worth doing for global SaaS brands. Where to prioritize may be another story.
What to Build
The practical version of the playbook based on what the data says:
1. When possible, start with versus pages. They carry the strongest single-page-type signal in the dataset (Spearman 0.65, 2x the next-best). For a client launching a comparison content program from zero, this is where to spend the first sprint of effort.
This said, it’s notable these are the most contentious page type, and if preference is to “feel out” transactional with less contentious “best X” and alternatives pages, that’s a reasonable path forward.
2. Invest in reasonable scale. Median AI search sessions jump 350% between the one to five bucket and the six to 20 bucket. That doesn’t mean you should scale out irrelevant content, simply that impact is felt the more comprehensive your transactional program is.
3. Layer in alternatives and best-X-software once VS is set. Both add incremental signal to your program. The total comparison count is what bucketed sites into the high-performing tiers, versus content just leads the contribution.
4. Set expectations honestly. Content explains about 28% of the variance in B2B AI search traffic. The other two-thirds is brand authority and category fit. Going from five to 21+ pages corresponds to a 900% median lift, a realistic forecast. Promising a category-leader-scale outcome from content alone is overpromising.
Methodology and Caveats
Using Claude and the Google Analytics MCP connector, we sampled 116 B2B GA4 website properties, trailing 90 days from the period ending May 24th, 2026. We measured AI search traffic as sessions classified as referrers from chatgpt.com, chat.openai.com, openai.com, perplexity.ai, claude.ai, gemini.google.com, copilot.microsoft.com, or meta.ai.
Comparison pages are defined as URLs containing “vs,” “alternative,” or “best…software” with at least 50 sessions in the 90-day window.
Counts are deduped per site, and false-positives were scrubbed, such as non-transactional “vs” pages (ex: inbound vs content marketing).
Pricing pages were tested as a fourth content type and excluded from the final analysis. Presence of a pricing page predicts AI traffic on a raw look, but the effect mostly disappears when controlling for the volume of other comparison content.
For statistical method, we used Spearman rank correlation across all 116 sites and Pearson correlation on log-transformed values for the plotted subset (sites with both AI traffic and comparison pages above zero).
Both methods report the same direction of effect; we lead with Spearman in the writeup because it’s more robust to the heavy-tailed distribution. A few limitations are worth flagging: 53 of 116 properties returned zero comparison pages, which was partly real (the client hasn’t built that content) and partly URL-pattern blind spots where comparison content lives in formats our regex didn’t catch.
A Few Final Thoughts
While staring at this analysis, a few observations emerge that are worth considering. First, there’s a possibility that versus pages are best at sending traffic, but “best X” and “X alternatives” are still top or near the top at driving influence. Those are different things.
It’s difficult to precisely measure that part (until we can look at before/after LLM citations as a next step), but it seems reasonable. Those multi-brand comparisons will most often point to a homepage, leaving users to do an off-LLM search or type in of the brand name that would be difficult to connect to this analysis.
The “vs” articles comparatively leave the LLMs with only one (or two) options for citation, so it’s a feasible outcome that a direct visit is a byproduct there that would not be the case with roundups. This said, we looked at overall AI traffic, so there is still a strong story that supports versus articles being the lead frame.
The second is that if this analysis fundamentally holds up, it re-frames how we should think about prompt tracking. Our current instinct is that it may be worth considering an entire “competitive comparison” categorization that looks at sentiment shifts between ourselves and competitors.
Our articles could then help plug those gaps, aiming to lift net sentiment to improve the probability that we are the winner when the final comparison is made by customers.
More to come here, but for now, let’s get to comparing.