
Surveys are a valuable tool for any content marketer. In addition to gaining insights on your target audience, that data can inspire long-form blog posts, white papers, ongoing trend reports, infographics and more.
Google Consumer Surveys is one of our favorite tools for building linkable content. After running more than 100 surveys, we wanted to share a how-to and best practices specific to content marketing.
First, why Google Consumer Surveys?
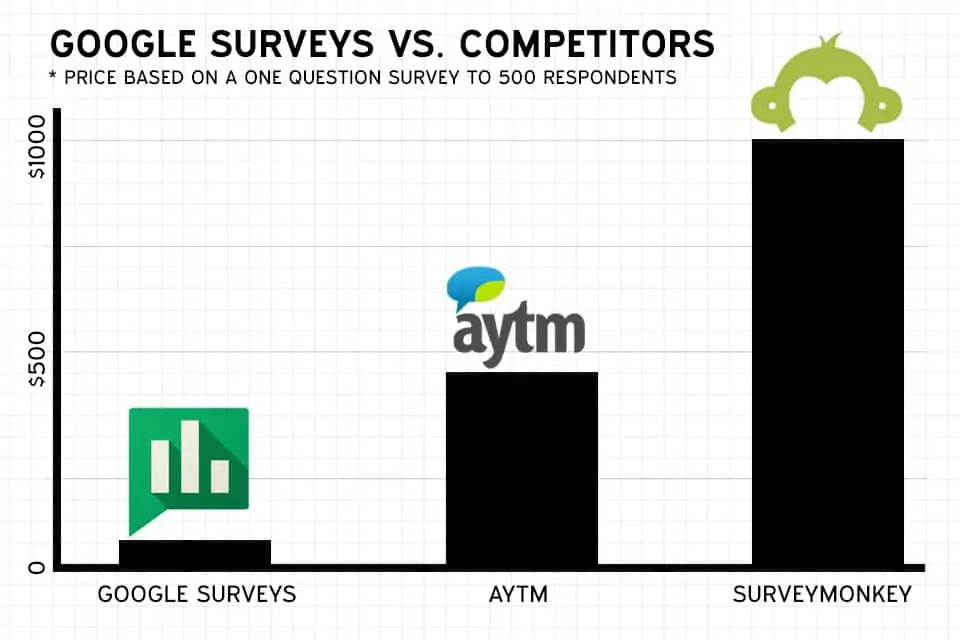
1) It’s cost effective. Funding a survey used to cost marketers thousands, but today Google Consumer Surveys makes it easy and inexpensive for anyone to gather credible data. As you can see below, Google Consumer Surveys is the least expensive among similar providers.
A few notes on the pricing models of the other two competitors:
- Both AYTM and Survey Monkey present your questions to pre-screened panels, as opposed to Google’s data collection method using paywalls and inferred demographics.
- AYTM offers 10 demographic traits (SurveyMonkey and Google Consumer Surveys both offer five).
- Competitors also offer support staff 24/7 or during business hours for questions or issues.
So while the other tools seem preferred for more in-depth market research, the benefit of wide spread (at low cost) makes Google Consumer Surveys the preferred option for wider reaching topics without as much need for laser-like precision.
2) It’s flexible. There are other online consumer survey tools, such as SurveyGizmo and FGI, but these come with a required monthly or annual contract. For content marketers running surveys on a project-by-project basis, subscribing to a plan may not be desirable.
3) It offers marketable quantitative data. There are actually very few providers that offer polling outside your marketing network (using your email lists, website visitors, etc.) and collect quantitative data (versus qualitative polling).
How does Google Consumer Surveys collect data?
Price and functionality are important, but you have to trust the data you collect. According to Google, users complete survey questions in order to access high quality content around the web, and publishers get paid a portion for the users that answer from their site.
Remember: Users are not there to answer your survey. This will greatly impact how you phrase and format questions.
So are you ready to dive in? Here is setting up, running, analyzing and perfecting a Google Consumer Survey:
Getting Started
After navigating to Google Consumer Surveys and logging in with your Google account, you’ll be brought to the main dashboard. From there, select “Create Survey” at the top right (if this is your first time ever creating a survey, Google will default you to the first step in the process).
Step one: Pick your audience. Don’t glaze over this section. Consider the question you’re asking and who you really want to glean insights from. For example, if your business primarily sells to women ages 25 – 40, perhaps your survey should filter males and other age groups out.

This is also where Google first introduces their pricing model. Your filtering options during step one have no impact on how much you’ll be charged for a survey. Instead, it’s all focused on how many questions you plan to ask. Here is the pricing for your reference:
| Questions | Price Per Complete |
| 1 | 10¢ |
| 2 | $1.10 |
| 3 | $1.40 |
| 4 | $1.70 |
| 5 | $2.00 |
| 6 | $2.30 |
| 7 | $2.60 |
| 8 | $2.90 |
| 9 | $3.20 |
| 10 | $3.50 |
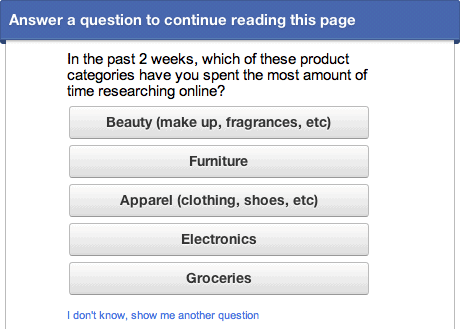
Step two: Write your question(s). This is where you’ll spend the most time reflecting (a.k.a. second guessing yourself). For the purpose of this guide, we’ll be focusing on single answer formats as we believe it’s ideal for content creation.
Open-ended leaves too much risk for outliers or false answers (more on that later) and single answer is best for gathering numerical data that fits the S.U.C.C.E.S. model.
During the second step you’ll notice some additional features, the most important one is the option to screen applicants before answering your survey. It’s extremely helpful, but also bumps your price up significantly. Here is an example question:

Pretty straightforward, but if you consider the growing rate of Americans that rent homes (regardless of age or region), this question quickly increases the risk of “junk responses.”
So an obvious qualifier question you’d want to ask is “Do you own a home?” If the answer is positive, the user goes on to question two.
Simple right? Here’s what happens to pricing:

Did that price suddenly catapult by 1,000%?! Depending on your budget, $1,000 may be a lot to throw at your survey. Don’t be discouraged though if you’re cash-strapped. The majority of surveys we’ve run are without a qualifier question, stay under $500 dollars and still gather valuable findings.
Step three: Final review. This is where you’ll input how many individuals you wish to survey. We suggest the minimum number of responses to be 500—anything less and you aren’t polling a large enough sample size. Then you can save and return to edit more later or purchase your survey.
While Google Consumer Surveys has made surveying “fool proof,” few digital marketers have a formal education in statistics and market analysis. To avoid wasting money on sub-par results, here are our best practices:
Skip the opt-in and choose “N/A” instead

Opt-in or no opt-in is a challenge, but some budgets may leave you no choice. So how do you drop the opt-in without opening yourself up to unqualified answers? By having “N/A” as a last option on your list.
With N/A, respondents can self qualify and you’re left with uncorrupted data. Looking at the question above, “N/A” can apply to anyone who doesn’t own a dog (or doesn’t go on vacations!).
Survey wording matters—a lot
Your survey should put users in the right frame of mind to answer it. Take these three questions for example:
- Do you dislike getting shots?
- Do you dislike getting shots for health benefits?
- Are you afraid of receiving a shot?
Did you answer differently to any of them? For simple one-question surveys, you may not have the time to test multiple formats. Pew Research provides general best practices in questionnaire design to help you avoid common errors and misleading questioning.
Ask a question with the story in mind
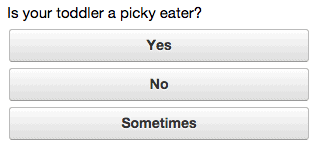
If you’re asking a question that comes with an obvious or uninteresting answer, it probably won’t make for a good story. The example above is a question about picky eating, but the collected answers aren’t coverable.
Why? Regardless of whether parents think their children are picky eaters, this question doesn’t get to the meat of the topic. “Picky eating” is also very subjective, one parent’s opinion of a picky toddler will greatly differ from another.
Ultimately, this question wouldn’t create a captivating headline, an important rule when it comes to S.U.C.C.E.S. content. A better option to ask parents would be “How often do you make a separate dinner for your child?” and gather those responses.
Beware of open ended questioning
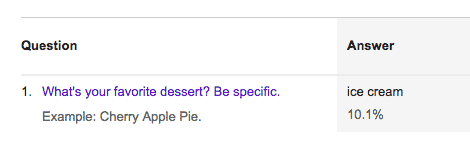
If you do decide to go with the open-ended question format, you have to remember the setup of Google Consumer Surveys. Because users are answering your question in order to get through a gated paywall, it’s highly likely they’ll type in anything general just to access their content.
If you’re asking users what their favorite dessert is and hoping for a specific answer, users are more likely to type in whatever first comes to their mind (in this case, “ice cream”).
To get complex, specific findings the best survey format is single answer. That way, users can respond quickly and you can pull numerical results (e.g. “75% of Americans prefer vanilla ice cream over chocolate”).
Research and sample your survey
Take some time to research the audience before drafting a question. For example, researching for a survey on female purchasing behavior and nurseries may find that women ages 45 and older are less likely to be shopping for these products compared to other age groups.
If there is a majority trait that contradicts your survey, it’s better to exclude that demographic.
Additionally, if you’ve conducted your research but are still hesitant to pull the trigger, test your question on a smaller sample of 100 – 200 people. This is an effective way to get a good feel for the type of answers you’ll be receiving without spending your whole budget on the first run.
Consider running multiple surveys

Instead of conducting one survey with the hopes of catching multiple findings, it may be more cost effective to separate your options out into individual surveys.
For example, the above survey used four separate samples, asking the same question just switching up the entity, versus one survey with four questions.
The difference? Running a four question survey to one group would have cost $1,700, while the other approach cost $400.
There is a downside to this. The science isn’t perfect because you’re not collecting from the same survey group, but including a large enough sample size (in this case, 4,000 total) can make up for this discrepancy.
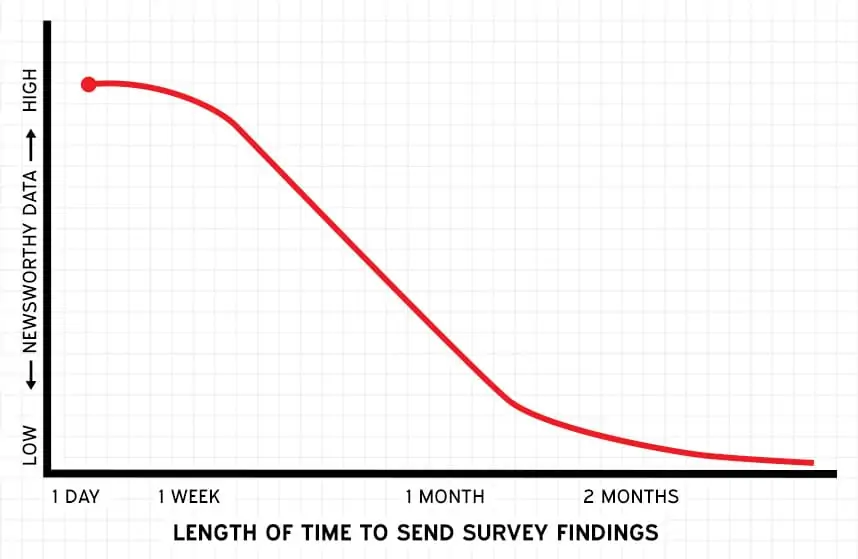
Check in on your survey
It’s tempting to “set it and forget it” when running a Google survey, but if you’re collecting the minimum respondents every answer counts. A day or two after running your survey, log in to see if it’s trending toward a newsworthy response.
If you’re not seeing favorable results, don’t immediately trash the whole survey. Instead, look into specific demographics of the responders and see if there are any you should exclude.
Unfortunately, you can’t edit or add onto an already published survey. If you’re running a sample survey or need to start over, you have to make a new survey and re-publish.
Dissect the data

The majority of our surveys are one question. Instead of only reporting on the primary answer you sought out to ask, download and dissect the data based on age, region, income and urban density (all provided by Google with your data).
Sample size for this matters so you can support making credible insights—a survey of 500 is enough to create a “meaty” story.
Google Consumer Surveys offers an “Insights” section to do this for you, but you have to have a large sample size in order to unlock it.
Time your survey with relevant news
The best kind of surveys are ones that can relate back to a current event or popular topic of discussion. They’re also ideal for pitching if you’ve honed your outreach skills. Craft a survey that supports the reporting of journalists and bloggers in your field.
Just remember: news only stays “new” for so long. Contacting a reporter with data for a story they published a month ago is too late for exclusive coverage.
Include your best stat in the headline
Positioning an intriguing or “clickable” stat in your post headline will increase your chances of the news being covered or shared. If you have a single question survey, you should anticipate designing your post title/subject headline for this “best stat.”
If you feel the stat isn’t a good fit for the headline (e.g. too sensational for the brand), then save it for the email subject line during outreach.
Here are some strong post title/outreach line examples:
Survey for CNN, Half of Americans can’t name Senate Majority Leader
Survey: 83% of people texted while driving this week
76% of America Says They Don’t Trust Real Estate Agents
One in Four Report Having Had Their Passwords Stolen
Provide a shareable graph

A recent study by Fract.l asked publishers what content format they wish they saw more of, and five of the top six requests were image based formats. High-quality images increase shareability, which is beneficial for both the publisher and the brand.
By including visual representations of your images in graph format, you make it easier for publishers to create engaging posts, quicker.
Like a mini-infographic, this representation can give publishers the ability to add 150-200 words of text, plus your graph, and make a post their readers will think they actually put work into.
Write a custom post brief for outreach
Custom post briefs on the surface look like a press release, but instead of standardized copy for a wire, each brief you send has a custom portion for the publisher.
This acts as a new age guest post, as many will directly use the custom portion you give them for their piece—therefore lowering the friction to cover your story.
Here is a template example:
SUBJECT: Story for [NAME]: [BEST STAT/FINDING]
BODY:
Hi [NAME],
We did a [SURVEY DESCRIPTION] that we thought [WEBSITE NAME]’s readers might like.
You can see it here: [URL]. The full story is below.
We’d greatly appreciate if you considered [SHARING IT/A STORY ON IT]. Thanks and we look forward to your feedback!
####
[HEADLINE WITH BEST STAT FOR EXTERNAL SITE]
[6-10 Word Summary]
[LOCATION, STORY DATE] – [OUR WEBSITE, WEBSITE DESCRIPTION], recently [100 WORD DESCRIPTION THAT COULD LIVE ON EXTERNAL SITE].
Read the full [STORY/POST] online [LINK TO SITE].
For more information about [OUR WEBSITE], visit [ABOUT PAGE].
###
About [OUR WEBSITE]
[50 WORD DESCRIPTION].
Media Contact
[CONTACT PERSON] [CONTACT EMAIL AND/OR PHONE #]
Taking the extra time to relate the survey to their readers, such as mentioning how their region answered or a specific age group, pays off big time in outreach success.
Who should use Google Consumer Surveys?
Don’t let the “consumer” part fool you, surveys are ideal for B2B. When done correctly, findings work well with existing content marketing tactics such as blog posts, email newsletters, social media and industry reports.
The data being represented as graphs, the most natural fit for it, is perfect for almost any B2B company.
For B2C, survey data often needs to be incorporated into an infographic or pitched outside general content. There are situations where one-off survey data is enough to make a story, but using it for more in-depth pieces of content is typically required in order to make it compelling in the B2C space.
Conclusion: Creating S.U.C.C.E.S. Surveys
In summary, your survey is a success if it achieves the following goals:
- Presents thought provoking data for discussion
- Findings are marketable to outside influencers
- Relates back to the overall brand funding the survey
When done properly, a survey can create above average linkable content for a below average cost. For B2B clients, it’s a go to for creating sharable content, and it can be just as attractive for the right B2C company, too.