We pulled session data from 115 unique sites. The average session duration is just the headline, but what it means for your business depends on a lot more.
The least useful number in our dataset is also the one most people come looking for: Across 115 clean properties, the median session duration is two minutes and 42 seconds.
Session duration is GA4’s measure of how long a visit lasts, but on its own, it tells you very little. What counts as a “good” duration varies wildly by industry, site size, and, most of all, your business model.
Instead of handing you one number to chase, we broke down our first-party data to show you which benchmark to use to measure your success, and how to tell a healthy number from a misleading one.
- Key Takeaways
- Session Duration Varies by Industry
- Business Model Is a Telling Lens
- Traffic Impacts Duration
- Duration and Engagement Rate
- Duration Can Indicate Site Health
- When The Numbers Look Too Good
- Improve Duration with Better Content
- Methodology
- Frequently Asked Questions
Key Takeaways
- The median session duration across all industries is two minutes and 42 seconds.
- Business model predicts duration better than industry does.
- Marketplace businesses lead with an average duration of four minutes and 10 seconds.
- Site size and duration form a U-shaped curve, with small and enterprise sites outperforming the broad mid-tier.
- Duration and engagement rate are both necessary for measuring success.
- “Sky-high” numbers are rarely a win, and they often reflect inflated averages from logged-in apps and connected devices.
Session Duration Varies by Industry
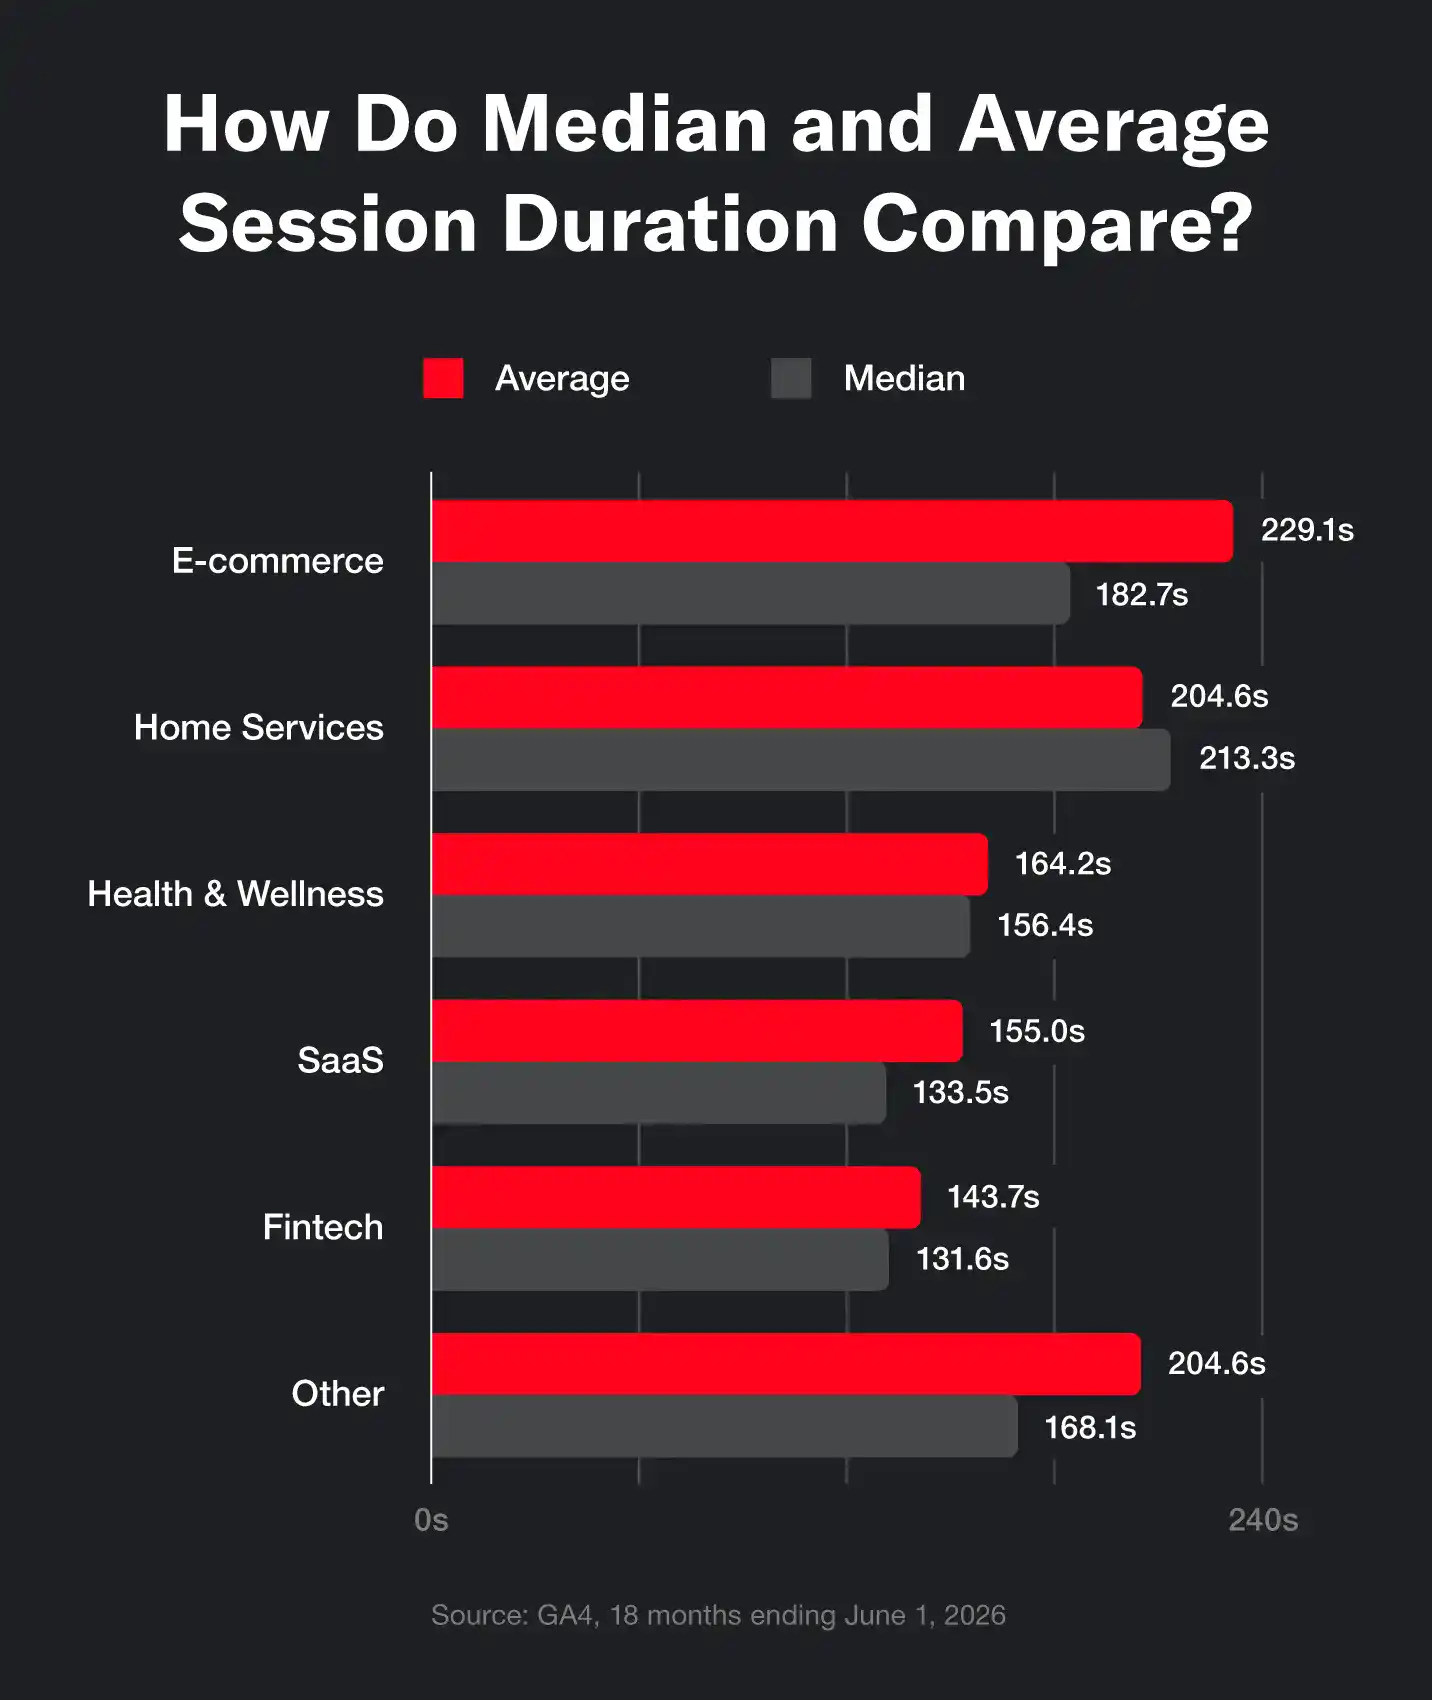
Our 115 properties fall into six industries, and the gap between the top and bottom average session duration by industry is close to 85 seconds:
| Industry | Average Session Duration | Median Session Duration | Average Engagement Rate |
|---|---|---|---|
| E-commerce | 229.1s | 182.7s | 62.7% |
| Home Services | 204.6s | 213.3s | 50.1% |
| Other | 204.6s | 168.1s | 57.5% |
| Health and Wellness | 164.2s | 156.4s | 49.7% |
| SaaS | 155.0s | 133.5s | 42.2% |
| Fintech | 143.7s | 131.6s | 47.2% |
There are a few patterns worth noting:
- E-commerce leads in average duration and engagement, especially when high-consideration purchases reward extended browsing.
- Home services leads the field in median session duration, indicating semi-consistent durations across these industry pages.
- Fintech posts shorter sessions, but most of its traffic is transactional or answer-seeking rather than focused on extended sessions.
- SaaS has the lowest engagement rate of any industry, even with mid-pack duration.
Also, we lead with the median (rather than the average) since larger sites can pull the average up. Plus, you can more accurately use these industry numbers to set realistic targets, rather than copy another vertical’s goals.
Business Model Is a Telling Lens
While industry is the lens everyone reaches for, it’s not the best indicator of your success. Instead, when we regrouped the same 115 sites by business model, the story became clearer.
Marketplace sites beat every model on both duration and engagement. They separate the top from the bottom as sharply as industry does, while being a cleaner, more actionable average session duration benchmark:
| Business Model | Session Duration Average | Session Duration Median | Engagement Rate |
|---|---|---|---|
| Marketplace | 250s | 204s | 65.8% |
| Local Service | 195s | 185s | 49.7% |
| Other | 181s | 168s | 54.8% |
| Transactional | 171s | 162s | 53.7% |
| Subscription / SaaS | 166s | 143s | 44.7% |
The reason is structural: On a marketplace site, browsing is nearly guaranteed. Listings, filters, comparisons, and discovery are designed to keep people moving from one page to the next, so sessions naturally run longer. A SaaS landing page, by contrast, is often doing its job when it answers a question fast and routes someone to a demo.
The takeaway for benchmarking is bigger than any single industry number. If you want a fair target to compare your data against, find the model that matches how your site works before you reach for an industry average.
Traffic Impacts Duration Significantly
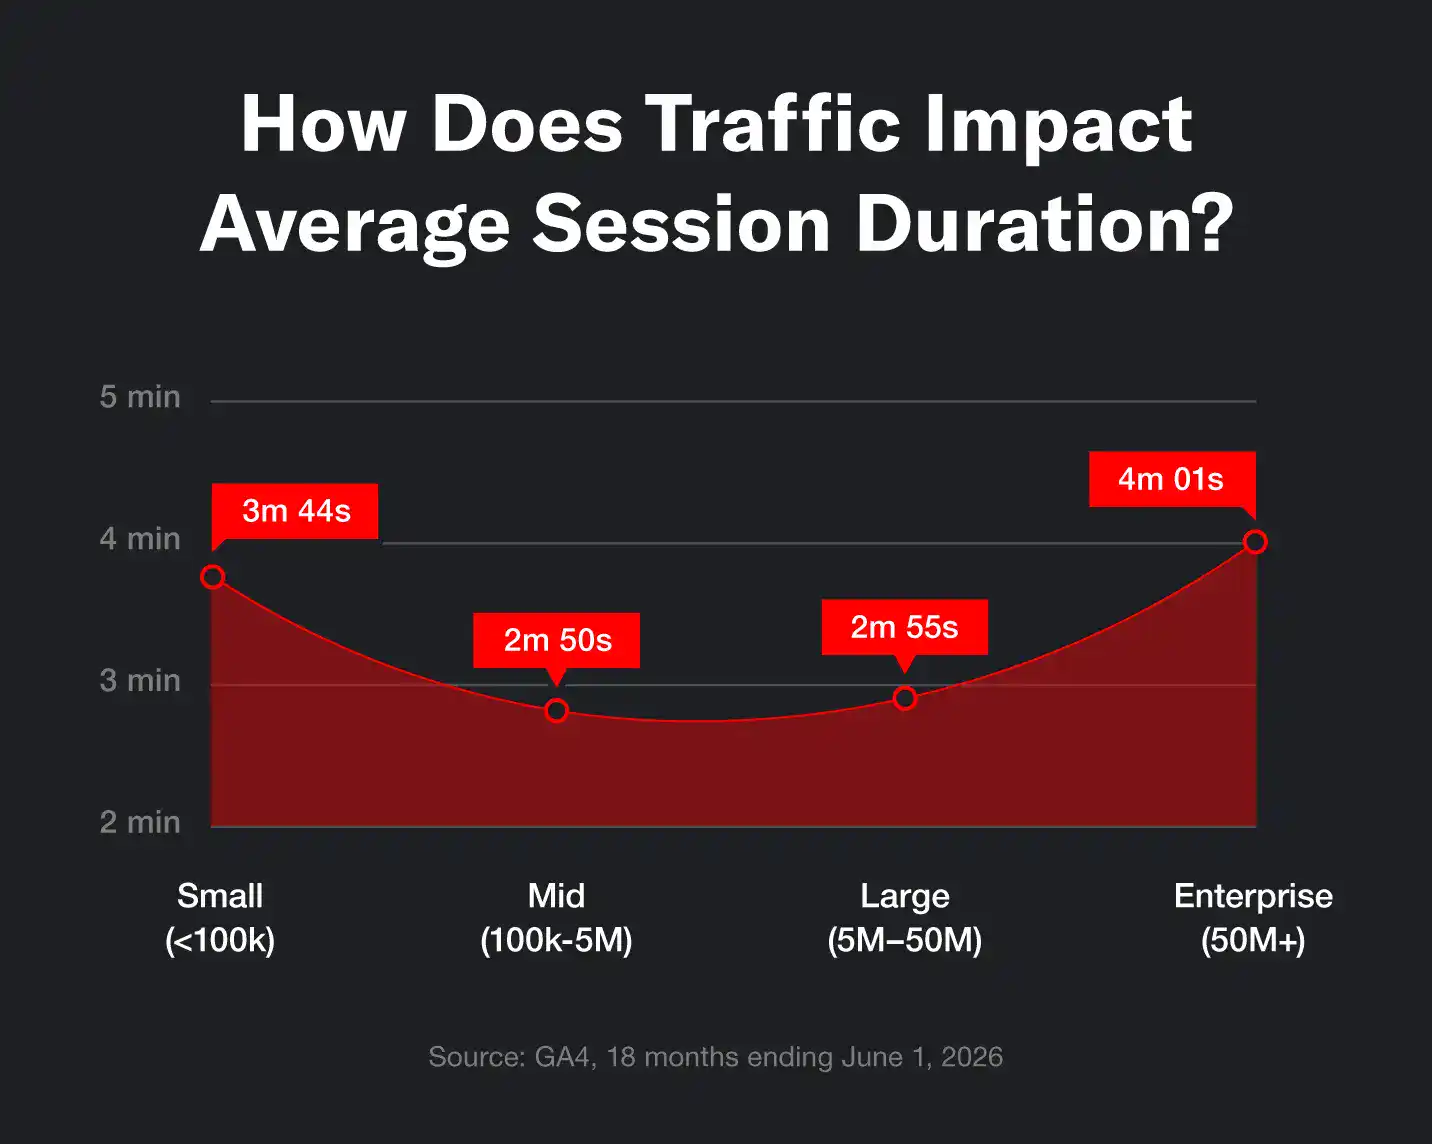
It’s easy to assume that duration climbs steadily with traffic, especially for bigger, more established sites. But the data actually proves the relationship is “U-shaped.”
| Tiers | Sessions | Average Duration | Engagement Rate |
|---|---|---|---|
| Small | <100k | 224s | 52.5% |
| Mid-Tier | 100k to 5m | 170s | 47.2% |
| Large | 5m to 50m | 175s | 51.3% |
| Enterprise | 50m+ | 241s | 63.2% |
Both ends of the spectrum outperform the middle, but the explanation is about audience quality, not content quality:
- Small sites tend to serve niche, high-intent audiences who actively search out their products.
- Mid-tier sites absorb the widest mix of traffic sources and content maturity, so the average gets diluted.
- Enterprise sites benefit from brand recognition, which pulls in more qualified, ready-to-engage visitors.
If your site lives in the middle, don’t measure yourself against an enterprise benchmark you’re structurally unlikely to hit.
Duration and Engagement Both Matter
Engagement rate and session duration measure different things, but they move together. Across our dataset of 108 clean properties (seven reported no engagement rate data):
- Sites with above-median session durations averaged a 56.4% engagement rate.
- Sites with below-median session durations averaged a 44.9% engagement rate.
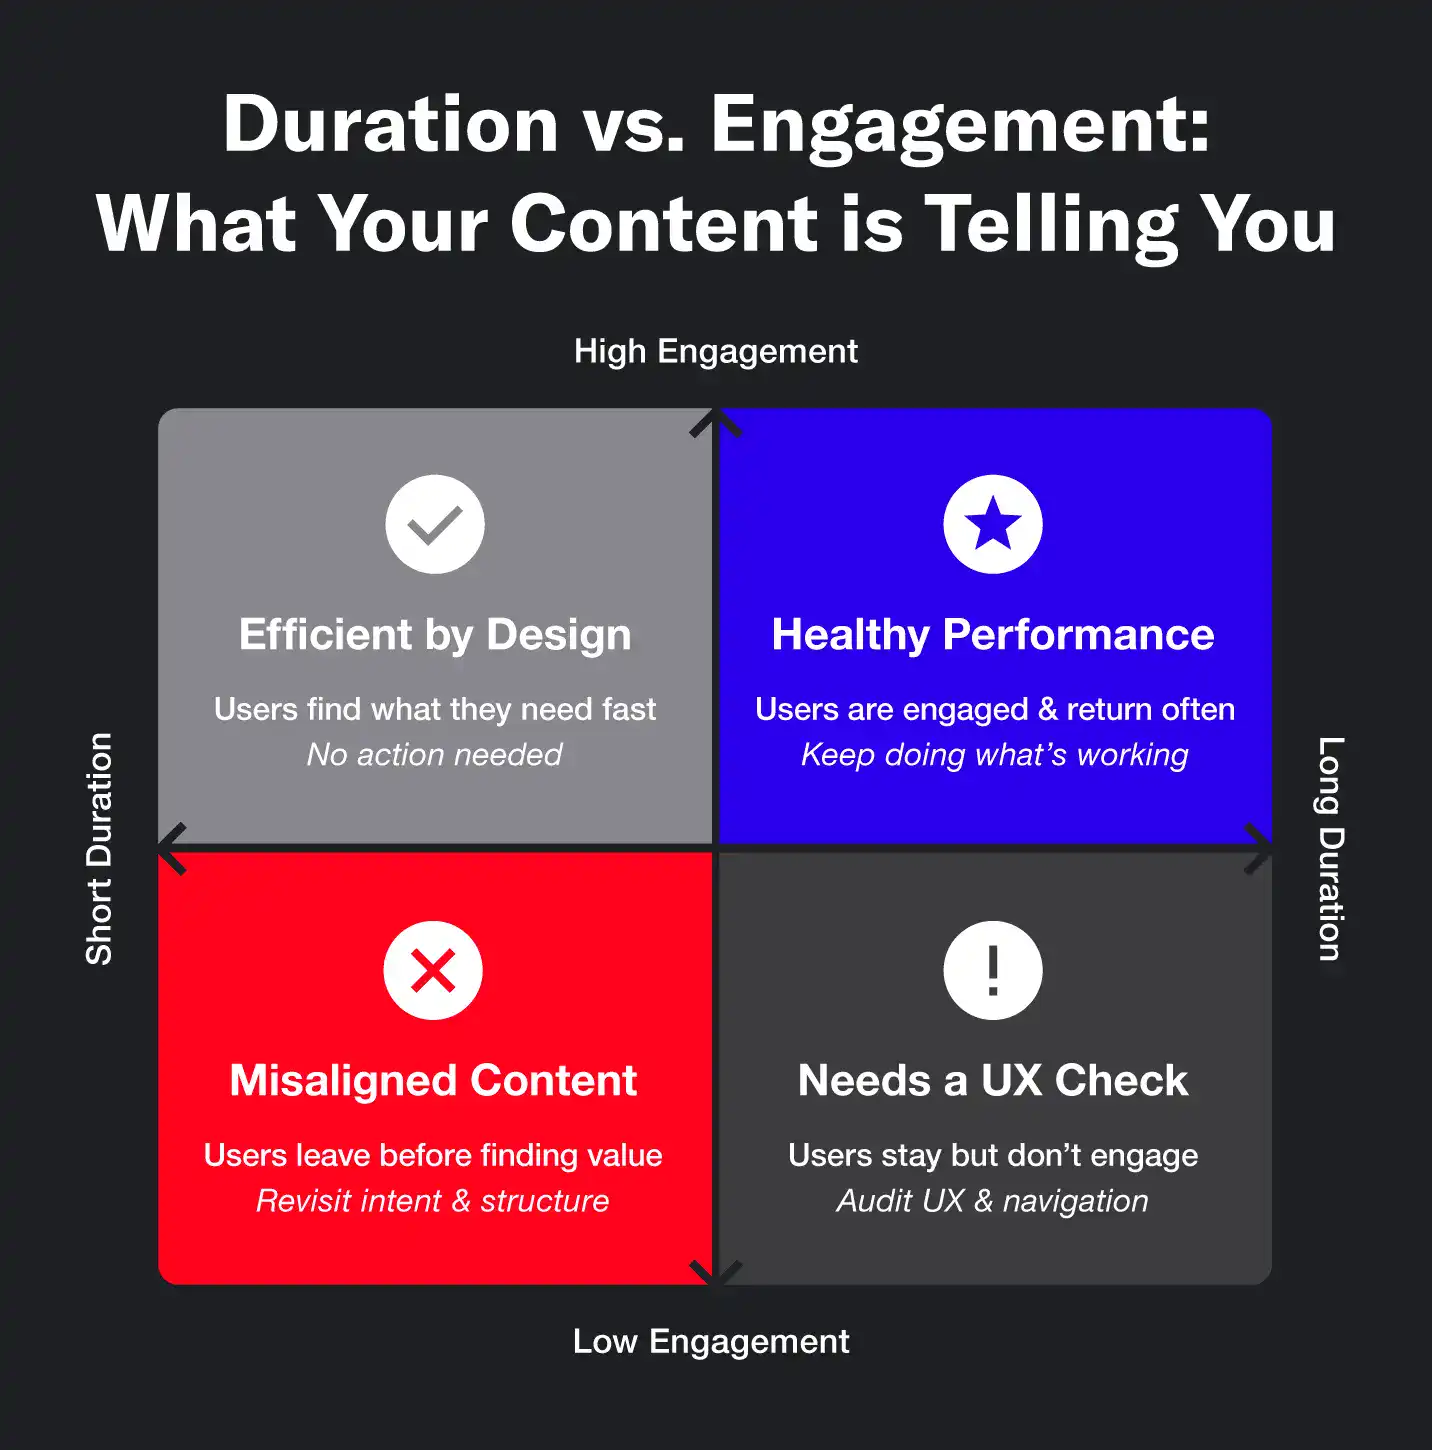
Duration tells you how long someone stayed on a page (whether active or not), while engagement rate tells you whether they did anything while they were there. A long session can mean your content is genuinely holding attention, or that your navigation is confusing and readers are lost.
When paired together, the two metrics are diagnostic. Read alone, you can’t see the whole story. This is why we never report a duration benchmark without an engagement figure beside it.
If you’re building a case for content investment, pairing the two is far more persuasive than arguing solely on duration. This is the same logic behind the LLM engagement patterns we see on research-heavy sites.
Duration Can Indicate Site Health
When looking at the relationship between duration and distribution, it’s clear that most sites (57%) cluster in the two- to four-minute range. This is the healthy middle, and it’s a reasonable place to want to be.
| Session Length (in minutes) | Share of Sites |
|---|---|
| < 2 | 22% |
| 2 to 3:59 | 57% |
| 4 to 7:59 | 19% |
| >8 | 2% |
However, the tails are where it gets interesting.
Sites with average durations less than two minutes aren’t automatically broken. For some, this could actually indicate strong off-page conversions or satisfied search intent (often for answer-based queries). However, these low rates could also indicate an unhealthy page with thin or mismatched content, or on-page friction such as slow loading times.
On the other hand, sites with average durations exceeding eight minutes may be experiencing bloat due to non-editorial sessions. This distinction brings us to the sites we had to set aside.
When The Numbers Look Too Good
We excluded 13 properties from our benchmarks above, but not because of bad data (in fact, the opposite).
Each of these omitted sites showed inflated session numbers due to one of two things: Logged-in product experiences or a device/app generating sessions.
If your own average session duration is dramatically higher than your industry or business model benchmark, consider these possibilities (before making any sitewide changes that could impact your performance):
- Dashboards: If an app and blog share a domain, long-term logged-in sessions blend into the site’s average.
- Workforce tools: Single sessions for tools like time clocks can span entire shifts.
- GPS, IoT, or device telemetry: When hardware pings the domain, this registers as ultra-long visits.
- Trading or financial platforms: Active monitoring keeps sessions open for long, uninterrupted stretches.
- Telehealth and patient portals: Authenticated medical sessions inflate the average well beyond editorial reality.
- Member and account portals: Platforms such as gyms, real estate sites, and career tools affect session length.
- Content tools and editors: Products where the actual work happens on the page itself can impact numbers.
Isolate marketing-only traffic before you trust the number. If you run a product on your marketing domain, separate your content from your product before benchmarking anything. Otherwise, you’re measuring your software, not your content.
Improve Duration With Better Content
Session duration measures whether your content gives people a reason to stay, and whether the right people found it in the first place. So the key features that impact the numbers? They’re the fundamentals of good content.
The best-kept duration secrets aren’t actually secrets at all: match format to intent, so the page delivers what the search actually wanted. Build depth and structure that reward scrolling. Use internal links to pull readers from one page to the next. And invest in the visuals and original data that hold attention and build your authority.
Done well, a better average session duration is a byproduct of content marketing that matches high-intent audiences with pages designed to hold attention and convert. The same strategies that help you earn citations and rankings across LLMs and on the SERP will impact session duration and engagement rate.
If your numbers look off or you’re not sure which benchmark to chase, that’s the kind of question a full-service GEO agency is built to answer. Siege Media can help you identify the lens that fits your business model, read duration and engagement together, and make sure your content is front and center.
Methodology
This study draws on first-party GA4 data from 115 live website properties across six industries. Our benchmark figures use GA4’s average session duration, which is total session time divided by total sessions.
Because GA4 measures a session’s duration as the wall-clock time between its first and last event, that figure includes time a tab spends idle in the background, which may account for some outlier averages.
A few additional rules shaped our dataset:
- Our measurement window was from January 1, 2025, to June 1, 2026.
- We excluded properties with fewer than 1,000 sessions.
- We removed 13 properties as outliers where logged-in product or device-driven sessions clearly inflated the average.
- Engagement rate was available for 108 of the 115 properties.
- Any segment with fewer than 10 distinct properties was folded into an “Other” group.
- All figures are GA4-native and anonymized at the property level.
Note: Benchmarks built on Universal Analytics are not directly comparable to GA4 figures. UA and GA4 model sessions and engagement differently, so mixing the two will mislead you.
Frequently Asked Questions
What Is a Good Session Duration?
There is no universal number representing a good average session duration. This statistic will depend on your industry, business model, and the intent behind your traffic.
For many sites, landing in the two- to four-minute range may indicate a decent average duration, but it’s best to compare your findings with sites that share your business model before coming to a conclusion.
What Is the Difference Between Session Duration vs. Engagement Time?
Session duration and engagement time measure two different things.
- Session duration measures the span between the first and last event in a session, and it still counts when a user has your tab open but isn’t actively engaged with your content.
- Engagement time only counts the time your page is the active, in-focus tab.
Engagement time is almost always the lower, more honest measure of attention.
What Affects Session Duration?
Several factors work together to affect session duration:
- Content type and page depth: Long-form and resource content hold attention, while product or landing pages don’t.
- Traffic source: Organic search sessions often run longer than paid or social sessions.
- Site speed and UX: Slow load times and clumsy navigation may cut sessions short even when content quality is high.
- Industry norms: Browsing-heavy models naturally run longer than answer-seeking ones
- User intent: Someone researching a purchase behaves very differently from someone checking a single fact.
Is Average Session Duration the Same as Time On Site?
Average session duration and average time on site are closely related, but not identical:
- Time on site is the older, general term that mostly refers to Universal Analytics’ average session duration.
- Average session duration is GA4’s modern equivalent, but the platform changed how sessions and engagement are calculated.
The differences mean users should treat current GA4 figures and legacy time-on-site numbers as separate baselines.