
We analyzed more than 13 billion website sessions to determine the share of mobile and desktop traffic. And while roughly 62% of our brands’ traffic is mobile, we found the split depends less on your audience and more on the job they came to do.
Many mobile vs. desktop traffic-share studies (whether by property or industry) quote a single global average and then stop. But a single number hides the real story: Device share is driven by the task a visitor is trying to complete, not by who they are.
From booking and browsing to buying and configuring, users reach for different channels based on their needs and goals. Two sites can sell to the same people, in the same category, and land on opposite ends of the mobile-desktop range.
Once you begin viewing your traffic by task, you can adjust your pages to address their real needs (across their most-used channels). Below, we dive into the industry benchmark so you can decide where to prioritize mobile optimization and where desktop truly shines.
- Key Takeaways
- The One-Number Traffic Myth
- The Full Industry Ranking
- B2B vs. B2C Isn’t the Whole Story
- Why Task Matters Most
- The Characteristics Industries Share
- Use Traffic Share Standards
- Methodology
Key Takeaways
- Across 13.4 billion sessions from 120 brands, 61.5% of traffic was mobile.
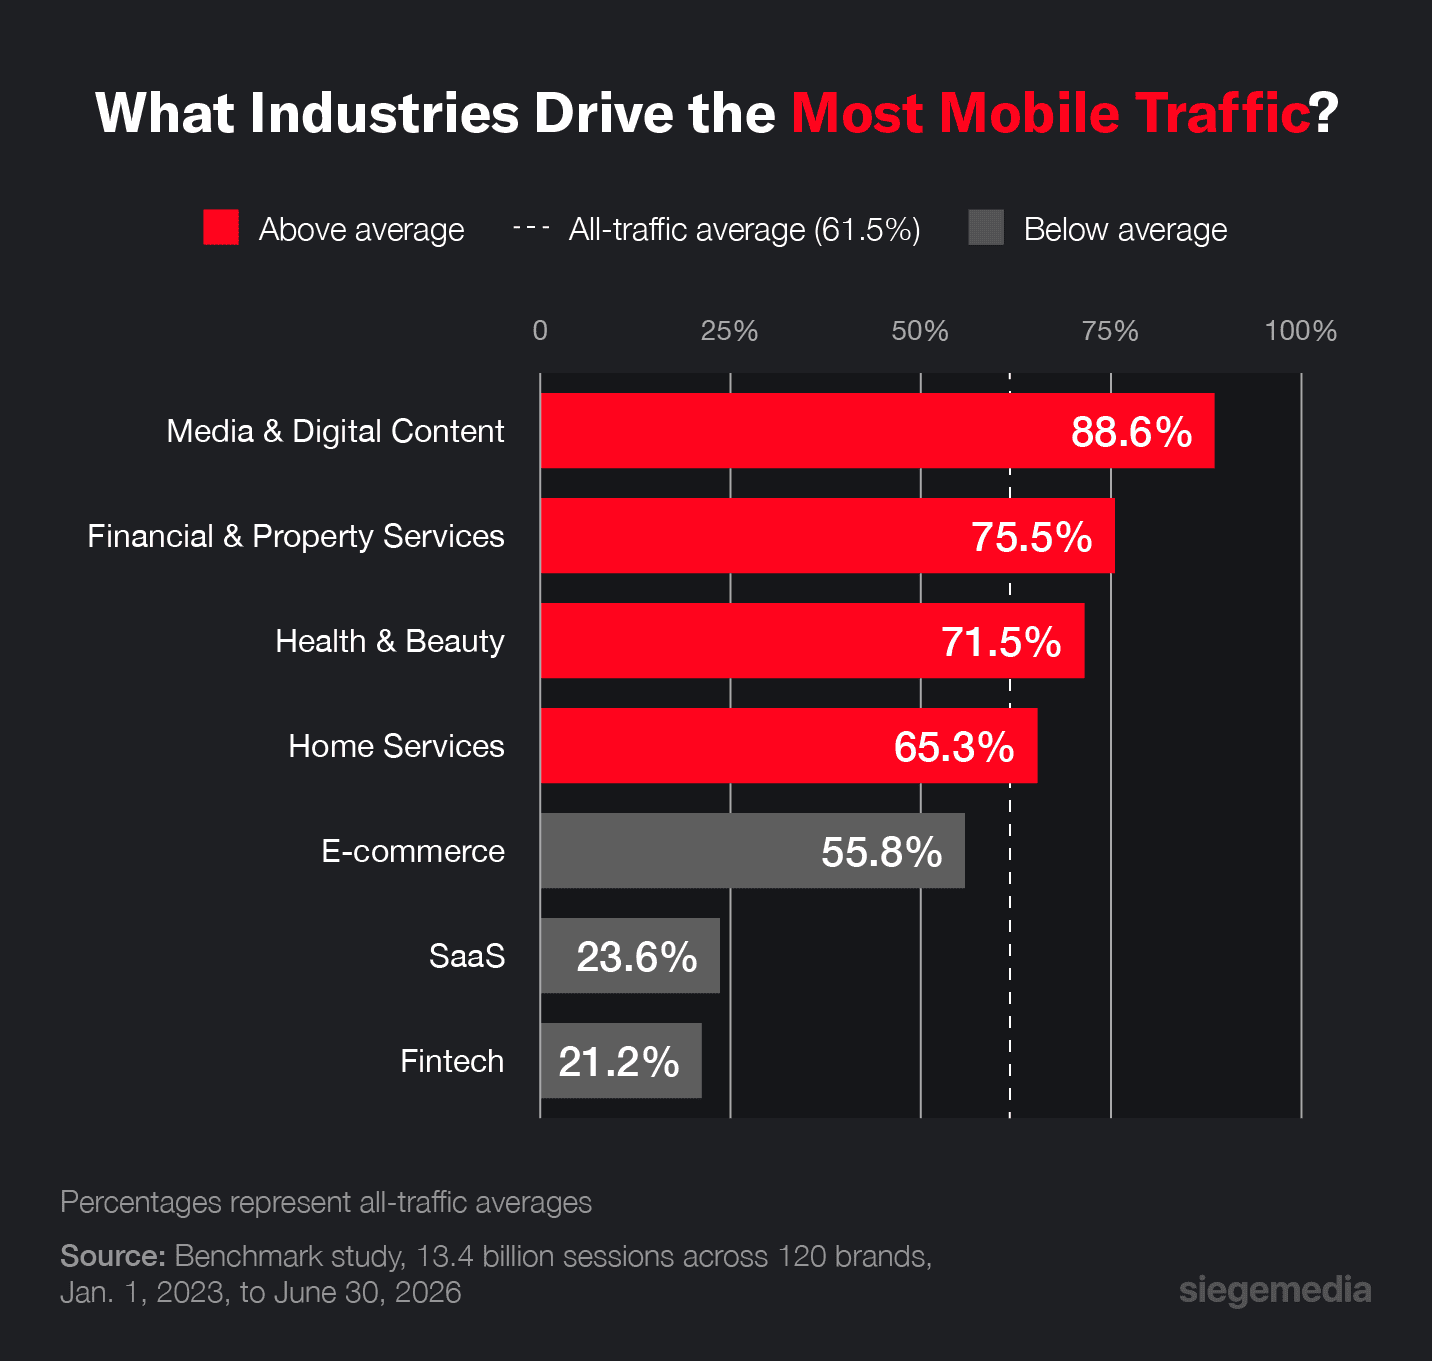
- The industry ranges for mobile traffic run from around 89% to 21%.
- Five of our seven industry groups are mobile-forward, and they account for roughly 69.7% of all sessions studied.
- Assuming a “mobile-first” strategy across brands optimizes for little-used channels for desktop-heavy brands.
The One-Number Traffic Myth
A single “mobile accounts for 60%+ of the traffic share” stat feels authoritative, and our finding lands right in the middle: About 62% of the 13.4 billion sessions we studied were mobile.
But an average this broad flattens the real data worth knowing. This average stitches together data from averages across media giants, e-commerce stores, and B2B software, telling you nothing about your visitors (or their needs).
Instead, sorting the same data by industry and viewing the range rather than the average gives you a more informative view of your own analytics. A single-number share of web traffic by device produces a spread too wide to be usable, especially since the only benchmark worth utilizing is your own industry’s.
Pro tip: Don’t treat the 62% stat as a simple target. Instead, plan your strategies and determine when (and where) to focus on desktop and mobile-first components based on industry and brand-specific data.
The Full Industry Ranking
For the full picture, we’ve ranked each industry from most mobile to most desktop. Plus, we report two views for each group:
- All traffic, which weights mobile sessions.
- Typical site, which averages all mobile sessions, so small and large brands count equally.
When those two columns diverge, it’s a potential sign that the group is carried by a few very large properties (which is worth noting before you read across the table).
| Industry | Mobile Sessions | Desktop Sessions | Mobile % (all traffic) | Mobile % (typical site) |
|---|---|---|---|---|
| Media & Digital Content | 4,314,581,950 | 554,151,967 | 88.6% | 59.8% |
| Financial & Property Services | 1,692,222,522 | 549,936,704 | 75.5% | 66.1% |
| Health & Beauty | 180,304,345 | 72,039,506 | 71.5% | 71.5% |
| Home Services | 81,411,541 | 43,344,471 | 65.3% | 62.3% |
| E-commerce | 1,045,141,633 | 829,162,370 | 55.8% | 65.3% |
| SaaS | 873,468,605 | 2,833,605,359 | 23.6% | 27.7% |
| Fintech | 76,145,267 | 283,435,328 | 21.2% | 37.6% |
- Media & Digital Content: Traffic differs between publishers (who drive mobile sessions, inflating the weighted average) and among travel, education, and consumer apps, which offer more balanced session counts.
- Health & Beauty: Both views converge because the industry’s brands are similarly sized and evenly weighted across traffic shares.
- E-commerce: Desktop-heavy giants pull the all-traffic figure down while the “typical” store often drives more mobile-first visits.
B2B vs. B2C Isn’t the Whole Story
In our data, the typical B2C site runs about 62% mobile, and the typical B2B site sits around 29%, with both holding steady since 2023. Below, we break down the B2B vs. B2C session shares (focusing on the average of sites):
| 2023 | 2024 | 2025 | 2026* | |
|---|---|---|---|---|
| B2B | 29% | 27.7% | 30.7% | 28% |
| B2C | 61.9% | 61.5% | 61.4% | 56.7% |
*2026’s averages are based on six months of data (January 1 to June 30).
The obvious explanation for this spread is the audience:
- Consumers are on phones
- Businesses are on desktops
While this explanation is a solid guideline, the exceptions are where the data gets interesting.
For example, writing tools may be sold to consumers, but users are more likely to use and purchase them at a keyboard, driving up desktop sessions. Plus, industrial distributors sell their products online, but procurement often happens on a desktop.
Pro tip: If your device split doesn’t match your segment’s average, your audience’s goals and actions usually explain the gap.
Why Task Matters Most
The cleanest proof that task beats audience shows up inside single industries, where categories split based on what the visitor came to do.
| Industry Subtype | Mobile-Heavy Example | Desktop-Heavy Example |
|---|---|---|
| AI Tools | Image generation tools | AI detection tools |
| Travel | Vacation rental sites | Travel planning services |
| Nonprofits | Donor-facing giving-day sites | Back-office platforms |
| Security | Residential sites | Commercial sites |
Looking at these examples and sites through an audience lens uncovers only half the story. Instead, viewing them through a task lens predicts device share better than any demographic.
The Characteristics Industries Share
Once you know where your brand or industry sits, you can identify the mobile- and desktop-heavy traits to prioritize. The top characteristics of each include a mix of user-intent considerations and website features, each of which can impact session duration and success.
Mobile-Heavy Industries
Traffic in mobile-heavy industries like healthcare and e-commerce is often driven by users who want to book, browse, or buy.
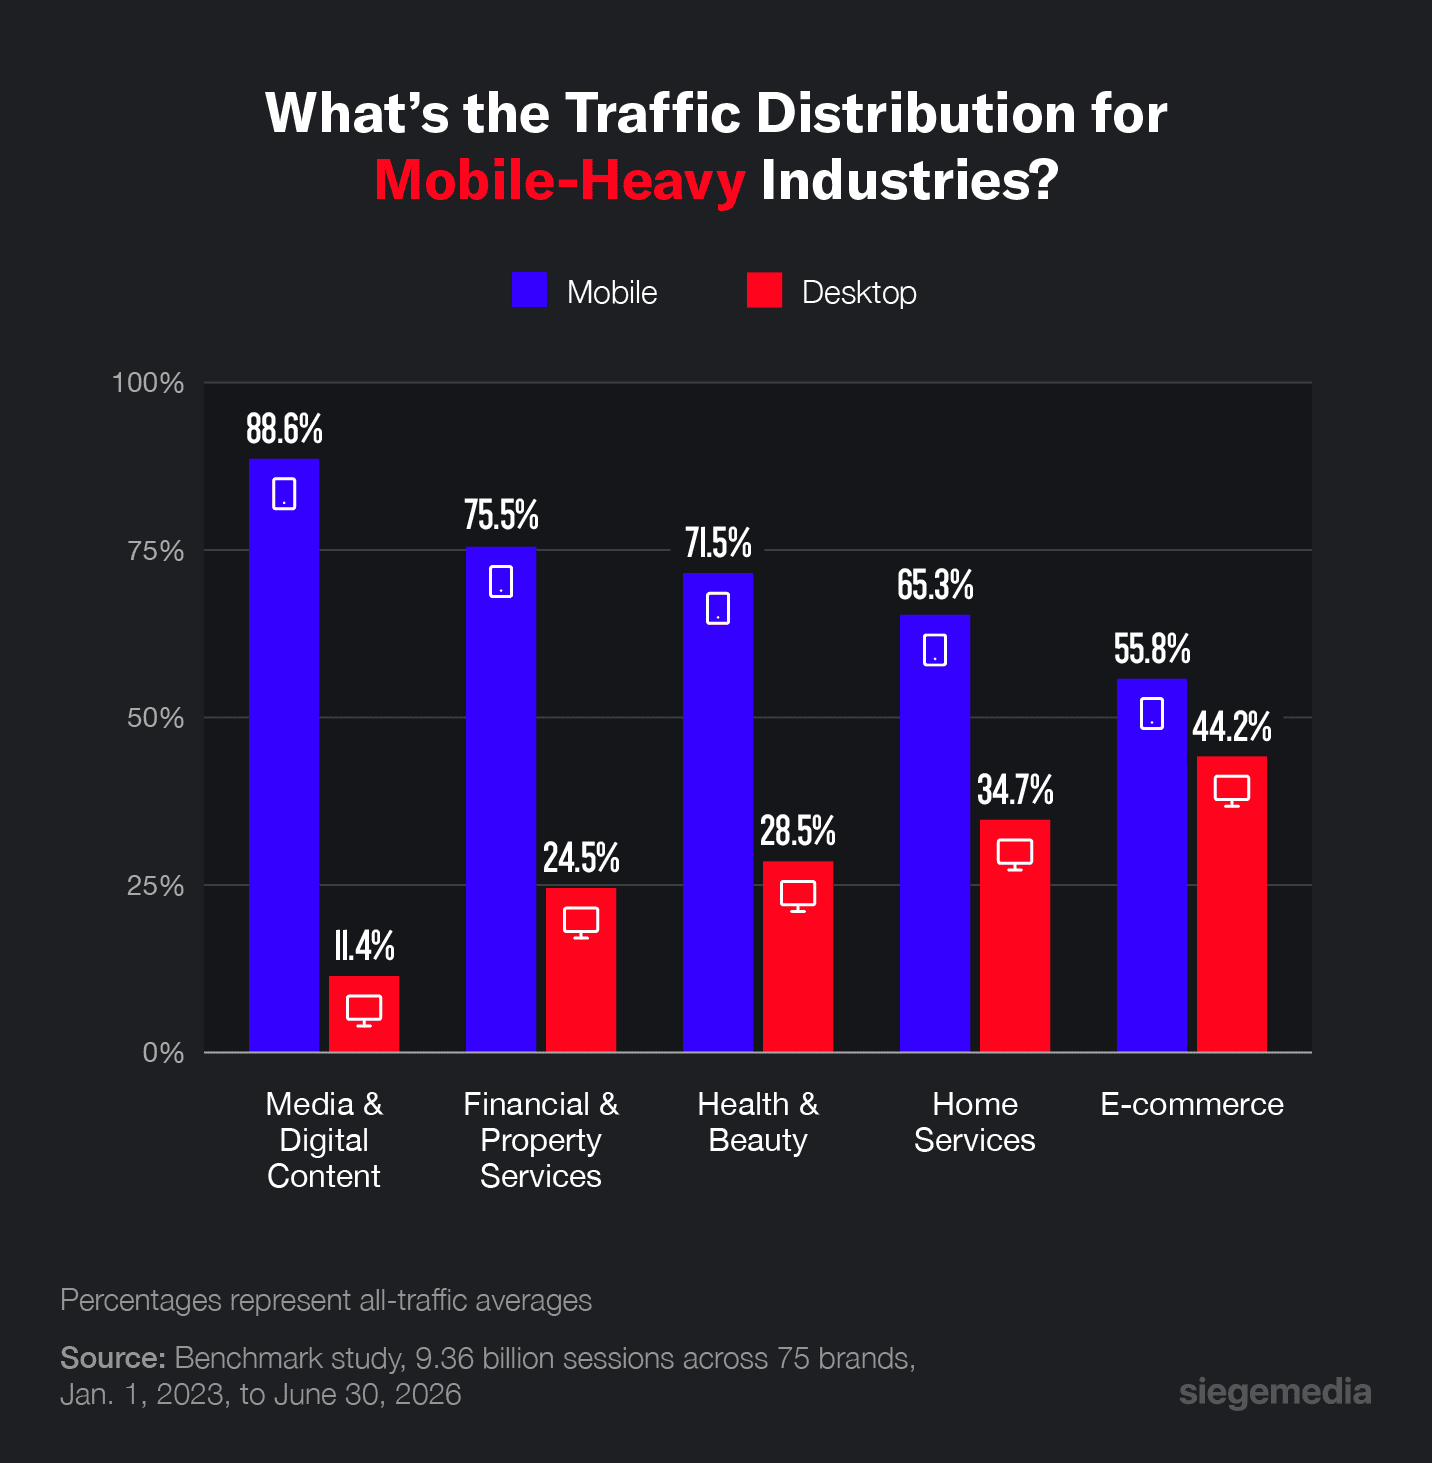
If your brand lives here, mobile optimization that prioritizes fast load times, thumb-friendly forms, and skimmable content should be your priority. Consider incorporating characteristics like:
- Quick, local, or urgent intent: Users often stick to in-the-moment errands, so optimize your site with buttons for appointment bookings, banking options, and other local service offerings.
- Impulse and discovery optimization: Browsing and scrolling often fit a spare minute, so stick to short copy with clear CTAs.
- Short conversion paths: Actions should finish comfortably on a small screen, including where tap-to-call buttons, quote forms, or booking links take customers.
Desktop-Heavy Industries
Desktop-heavy industries typically focus on research and evaluation, with an emphasis on earning visits by ranking across traditional and generative search engines.
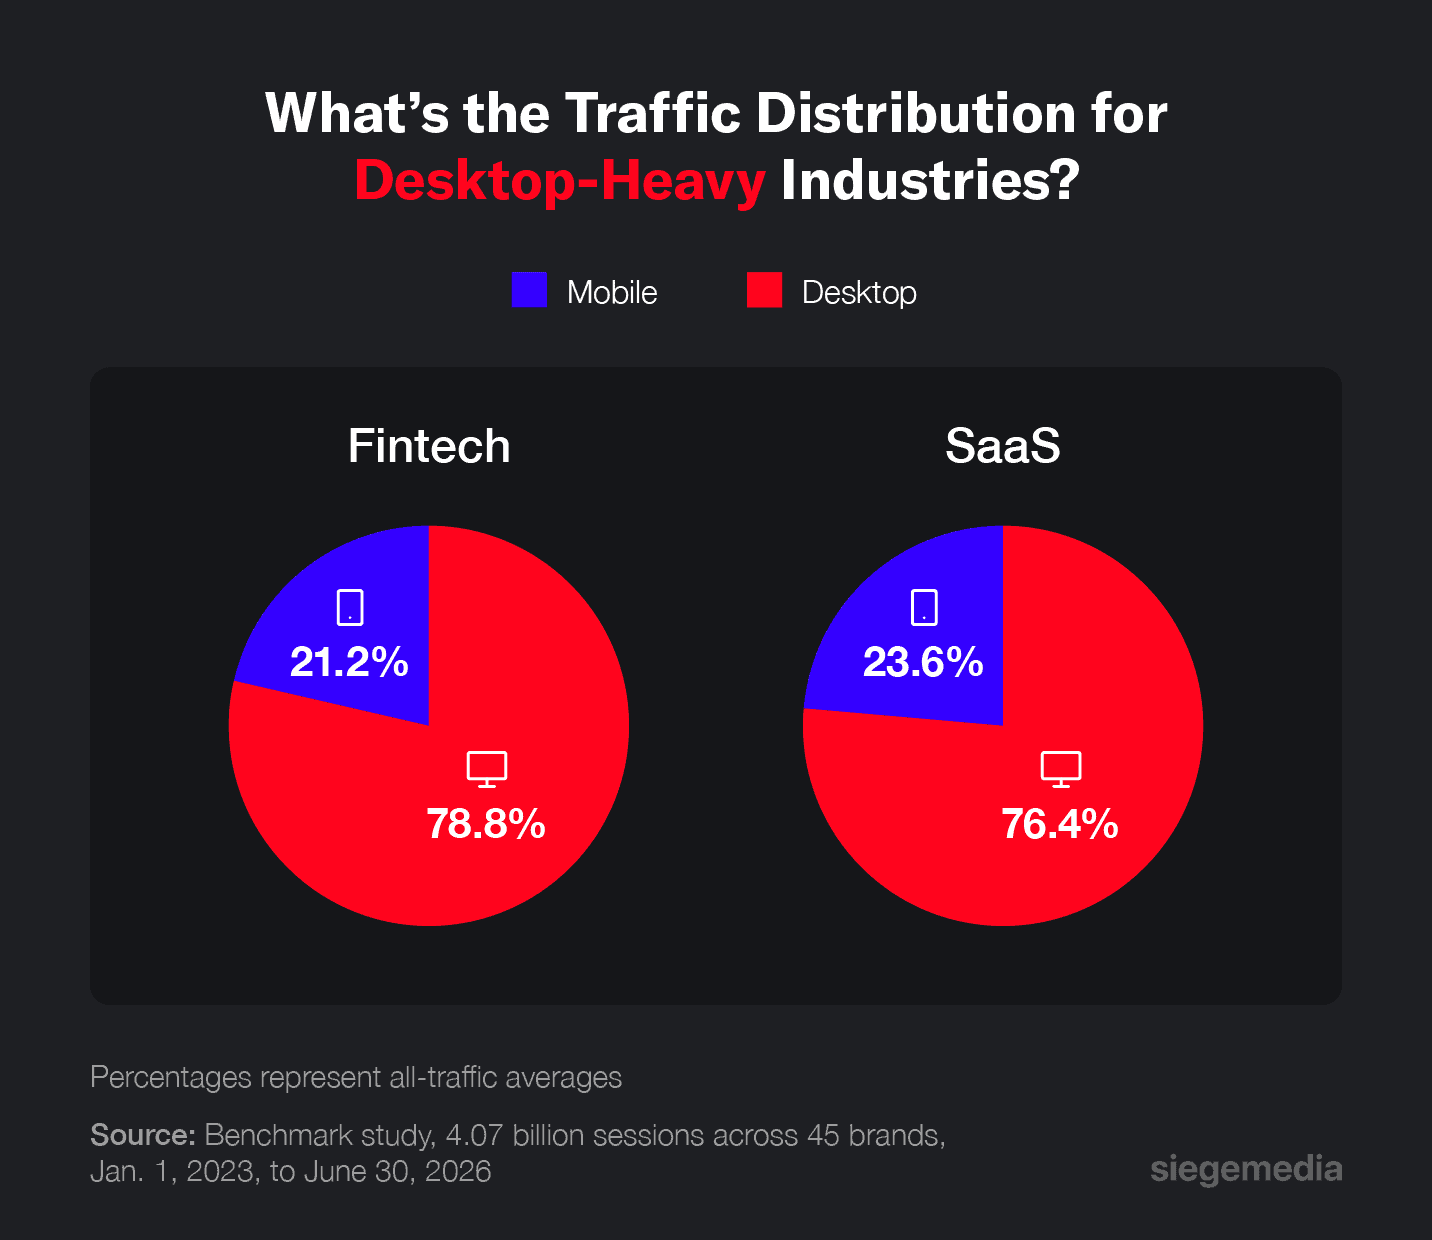
This end of the spectrum often requires you to prioritize the opposite feature profile, including:
- In-depth configuration and evaluation: Tables and HTML elements should simplify how users compare plans, read documentation, and run trials.
- Scalability: Team-focused tasks and offerings, including procurement and account administration, should adapt to your audience’s needs.
- Industry- or task-specific demos or trials: Provide niche, product-mapped demos and trials that showcase your product or service’s strengths (and optimize them for larger screens).
Prioritize Traffic Share Standards
A generic “mobile-first” mandate may help some brands, but intentional optimizations for both screen types will bring more success and satisfaction. The practical move is to stop focusing on the global share of desktop vs. mobile web traffic and instead start with your industry’s benchmark. From there, let your users’ dominant tasks set your priorities.
To turn insight like this into content and pages that rank across search engines and AI answers, partner with a full-service GEO agency.
Reach out today to develop strategies tailored to the sources of your traffic.
Methodology
This study is built on original, first-party data. We analyzed 13.4 billion mobile and desktop website sessions from 120 brands, spanning 26 detailed industries that we grouped into seven for the ranking above. The data covers January 1, 2023, to June 30, 2026 (noting that 2026 is a partial year covering six months rather than 12).
Each brand is represented by one production property. For each property, we measured desktop vs. mobile web traffic, excluding tablet and smart TV traffic. Additionally, we report two views of the same data:
- Mobile’s share of all traffic, which weights every session equally and shows where volume actually falls.
- Mobile’s share for the typical site, which averages across brands, so large and small properties count the same.