

We analyzed engagement rates across more than 500 websites and 16 billion sessions, and the median is 51%.
However, determining whether your own rate is “good” is surprisingly difficult. Google doesn’t publish an average engagement rate to measure yourself against, and most of the numbers floating around are either guesses or measuring something else entirely.
We built our own benchmark from the ground up, using first-party data to settle the debate across industries. Rather than generic global averages, we provide accurate figures you can compare against your own site.
If you’re looking to benchmark your TikTok videos or Instagram reels, this isn’t the data you need. Instead, our guide breaks down GA4’s website engagement rate and provides a short list of levers to move it.
GA4 engagement rate is the percentage of sessions on your site that are engaged. Across more than 500 websites, the median GA4 engagement rate is 51%, making a rate of 50% or higher generally considered “good.”
- What Is GA4’s Engagement Rate?
- What’s a Good Engagement Rate?
- Engagement Rate Benchmarks
- How To Improve Engagement Rates
- Turn Engagement Rate Into Growth
- Methodology
- Frequently Asked Questions
What Is GA4’s Engagement Rate?
GA4’s engagement rate is the share of your sessions that are engaged, or engaged sessions divided by total sessions. Google defines an engaged session as one that:
- Lasts longer than 10 seconds
- Triggers a key event (previously known as a conversion)
- Has at least two page or screen views
Sessions only need to meet one of these conditions to count as engaged. This has also been referred to as “engaged sessions per session,” and if you’re coming from Universal Analytics (UA), engagement rate is essentially the inverse of the old bounce rate.
The GA4 metric measures the quality of sessions on your website. A social media engagement rate, while it shares the same name with our GA4 counterpart, is a unique calculation.
What’s a Good GA4 Engagement Rate?
The median engagement rate across the sites we analyzed is about 51%. As a quick rule of thumb, a good GA4 engagement rate is 50% or higher, and anything north of 55% is strong.
An “average” engagement rate is not necessarily a “good” engagement rate. A good engagement rate will be higher than where most sites land (or, for simplicity, the average). This distinction also depends on your context, including the industry your site is in and the mix of devices and traffic sources your site sees.
Example:
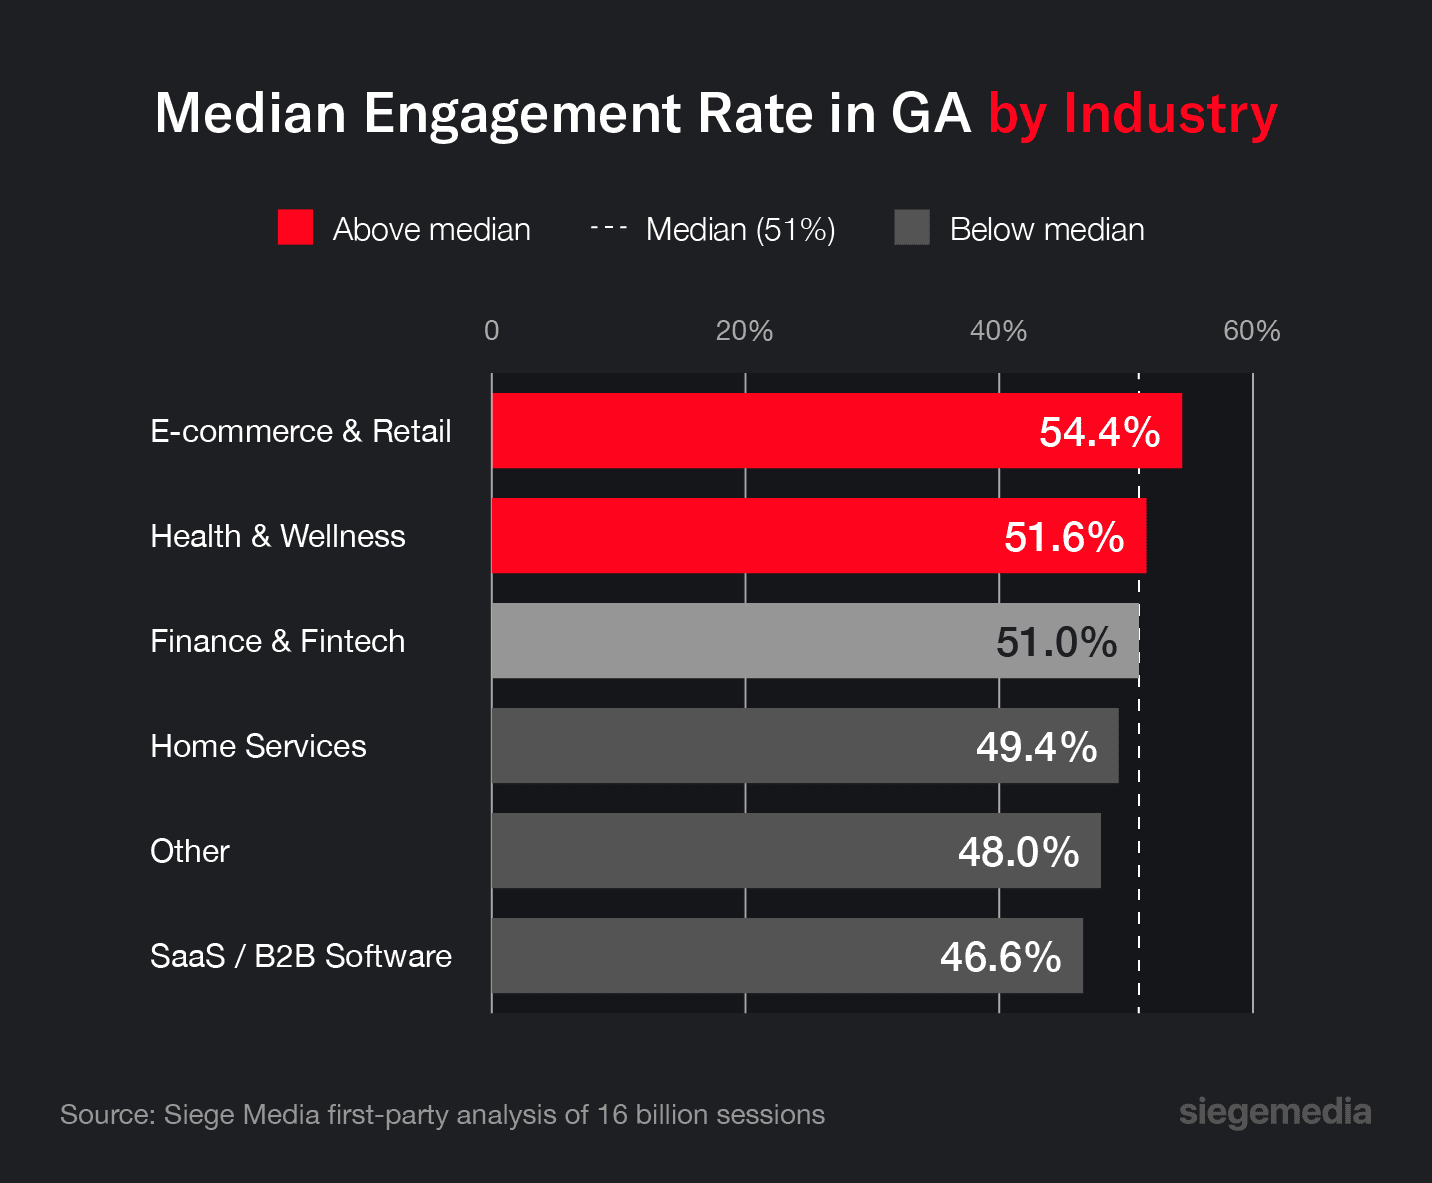
A 48% engagement rate might be below average for an e-commerce site, given that the industry median is 54.4%. However, this may be a perfectly healthy engagement rate for a SaaS blog, which often sees average rates under 50%.
Engagement Rate Benchmarks
What most people actually want to know is whether their engagement rate is good for a site like theirs. Below, we showcase the engagement rate cut by industry, device, and channel.
GA4 Engagement Rates by Industry
Breaking down the data by industry reveals a distinct trend. E-commerce and retail sites, where users are actively in the buying process, engage best. The SaaS and B2B industry trails the field, since much of their traffic lands on top-of-funnel content during long, comparison-heavy research cycles.
Note: Our “Other” category includes multiple verticals, such as insurance, nonprofit, travel, media, and legal.
| Industry | Median Engagement Rate |
|---|---|
| E-commerce & Retail | 54.4% |
| Health & Wellness | 51.6% |
| Finance & Fintech | 51.0% |
| Home Services | 49.4% |
| Other | 48.0% |
| SaaS / B2B Software | 46.6% |
GA4 Engagement Rates by Device
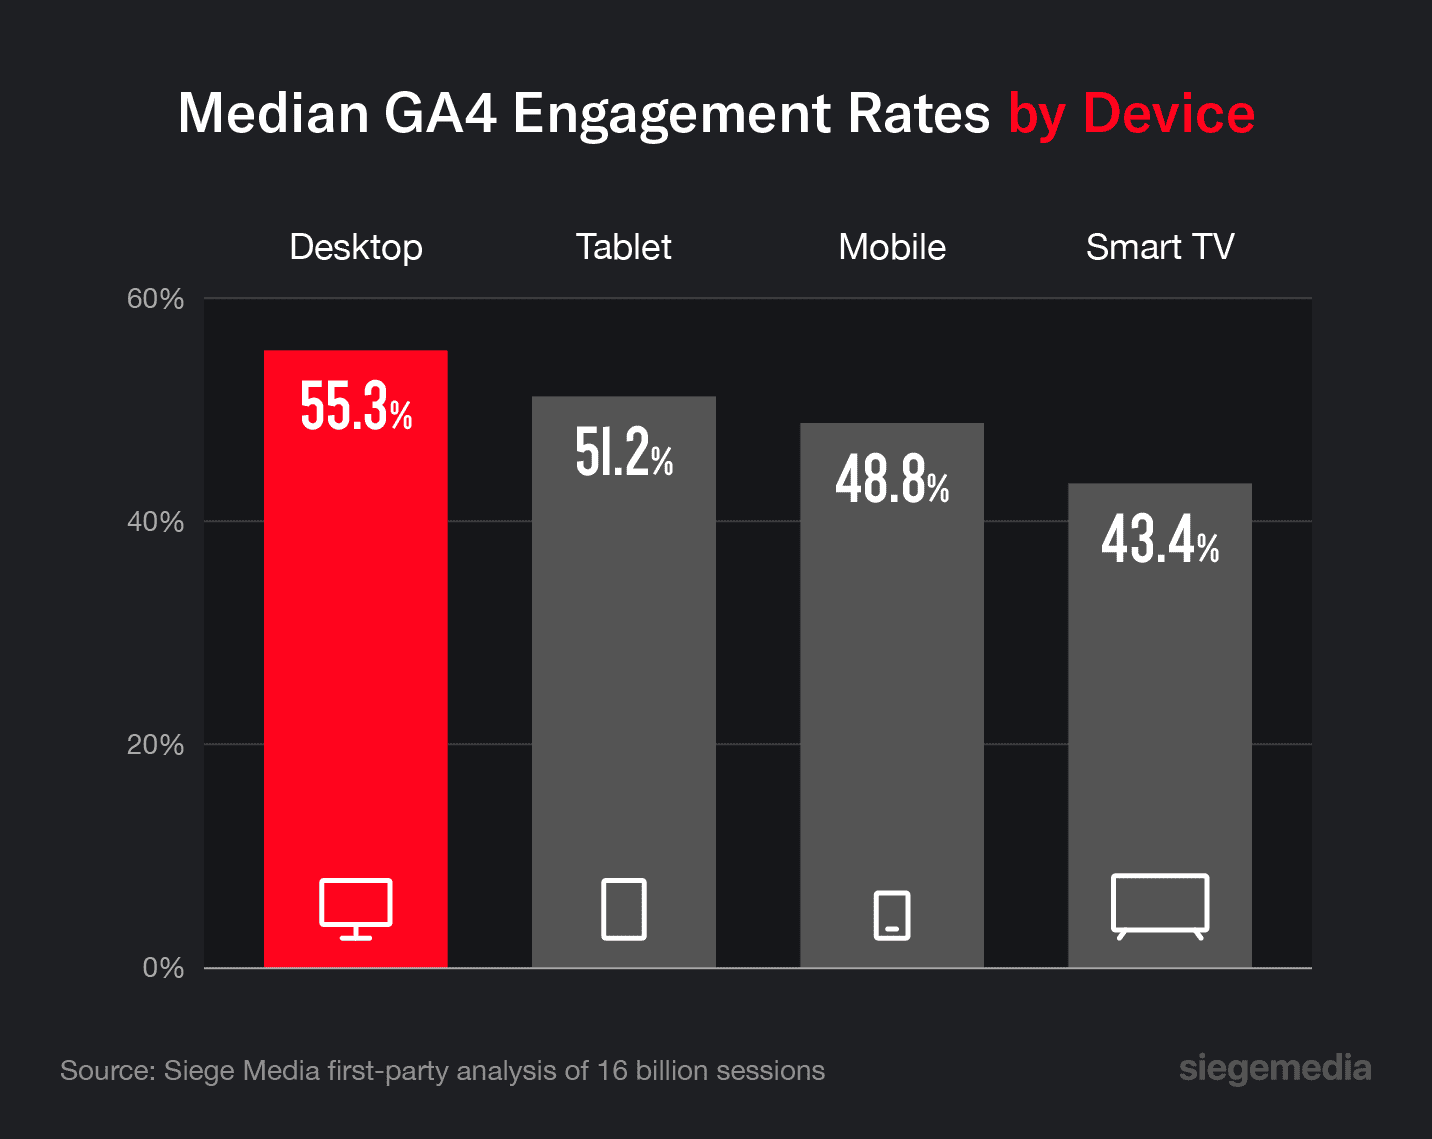
Desktop sessions engage nearly seven points higher than mobile, which indicates that device mix alone could move your overall rate. Before you conclude your content is underperforming, check your device split. Then, consider pairing the engagement rate with average session duration to see whether short mobile sessions are the real story.
| Device | Median Engagement Rate |
|---|---|
| Desktop | 55.3% |
| Tablet | 51.2% |
| Mobile | 48.8% |
| Smart TV | 43.4% |
GA4 Engagement Rates by Channel
Where your traffic comes from is the clearest predictor of how it will engage. Based on GA4’s default channel groups, we found that intent-rich channels engage roughly three times as well as interruption-based ones.
- Organic and paid search lead as searchers arrive with active intent.
- Paid social and display channels trail because visitors don’t come looking for them (even if the pages are excellent).
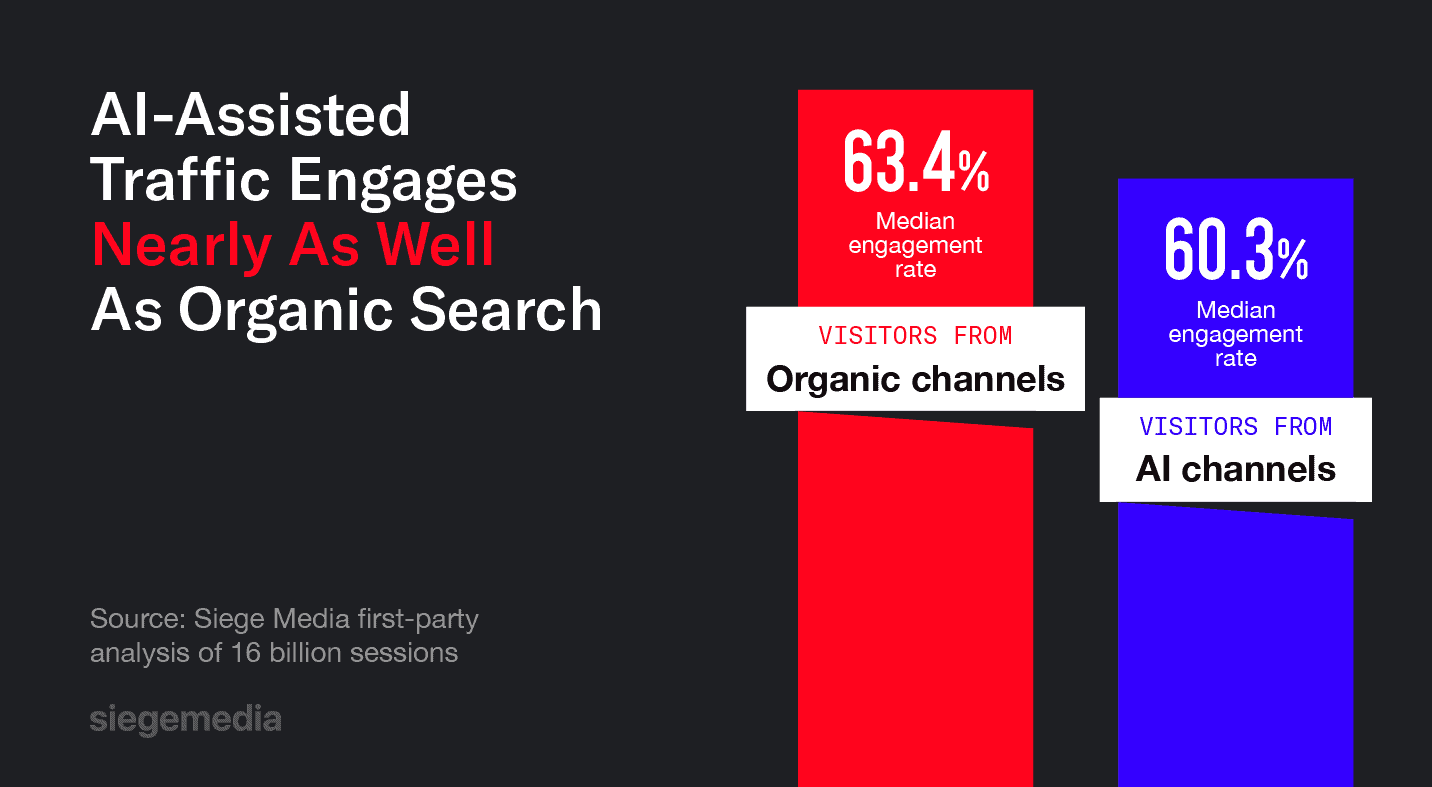
- AI assistants currently engage similarly to organic content, showcasing that AI-referred traffic lands with real intent.
| Channel | Median Engagement Rate |
|---|---|
| Organic Search | 63.4% |
| SMS | 63.1% |
| Paid Search | 60.4% |
| AI Assistant | 60.3% |
| Referral | 59.1% |
| 50.9% | |
| Organic Social | 49.9% |
| Direct | 45.7% |
| Display | 31.9% |
| Unassigned | 20.8% |
| Paid Social | 20.2% |
How To Improve Engagement Rates
If your rate is below your standard, these are the levers that actually impact website engagement. They’re ordered by impact, so treat the table as a rough priority list.
| Lever | Impact | Action |
|---|---|---|
| Match content to intent | High | Audit high-traffic pages, such as comparison and versus pages, against the target query, and rework those that don’t deliver what visitors come for. |
| Improve Core Web Vitals | High | Review your scores in PageSpeed Insights, then speed up load times and eliminate layout shift so your pages are usable before the 10-second engaged-session threshold. |
| Prioritize mobile UX | High | Remove intrusive pop-ups and cookie or newsletter interstitials, adjust font size, and make CTAs clear with clickable buttons and sticky navs. |
| Strengthen internal linking | Medium | In the copy and recommended reading sections, point readers to the next logical page so that more sessions clear the two-page-view bar. |
| Fix unassigned tagging | Medium | Add proper UTM parameters to your campaigns so that traffic leaves the low-engagement “unassigned” bucket and your reported rate reflects reality. |
| Set reasonable expectations for low-intent channels | Low | Segment paid social and display in GA4, then measure them on channel-appropriate goals so they don’t distort your site-wide rate. |
Turn Engagement Rate Into Growth
Engagement rate reflects whether or not your website is designed to drive longer sessions with clear CTAs and link paths. And knowing the average engagement rate for your context turns a vague statistic into a specific target you can actually move toward.
More importantly, this data points to where you should focus your efforts, whether that’s content-market fit or a smarter channel mix. And the AI-assisted benchmark should stand out to you, as engaged traffic from AI engines will only continue to grow.
Earning engagement across traditional and LLM search is what our full-service GEO agency is built to do, so reach out today to turn these benchmarks into your targets.
Methodology
These benchmarks are based on a first-party analysis of 546 GA4 properties. Spanning more than 16 billion sessions from January 1, 2024, to August 1, 2026, these figures are aggregated and anonymized. Each industry category contains at least 10 distinct properties, and each category’s core-set session count ranges from 1,000 to 50 million.
Engagement rate is calculated in GA4’s default way, dividing engaged sessions by total sessions. We report the median rather than a session-weighted average, so high-traffic sites don’t distort what’s typical. For industry cuts, we use a client-level median while excluding staging, test, and app data streams, as well as statistical anomalies.
Frequently Asked Questions
Is Engagement Rate the Same as Engaged Sessions?
Engagement rate and engaged sessions are similar but different. Engaged sessions are the number of sessions that met GA4’s engagement criteria, while the engagement rate is that number divided by the total number of sessions (expressed as a percentage). However, “engaged sessions per session” and “engagement rate” are the same ratio.
How Is GA4 Engagement Rate Different from Social Media Engagement Rate?
GA4 and social media engagement rates assess different things:
- GA4 engagement rate: Measures website session quality
- Social media engagement rate: Measures interactions, such as likes, comments, and shares, which are divided by followers or reach
What’s a Good Engagement Rate By Industry?
A good engagement rate can vary substantially. These are the median engagement rates by industry, which can be used as the baselines for “good” rates:
- E-commerce and retail: 54.4%
- Health and wellness: 51.6%
- Finance: 51%
- SaaS and B2B: 46.6%
Is a 40% to 60% Engagement Rate Good?
A rate in the 50%-60% range is good to strong for most sites, since the median is about 51%. While a rate around 40% isn’t necessarily bad, it’s typically below average. Before assuming a content problem or low engagement rate, check your device and channel mix.