We pulled data for new vs. returning visitors from 410 websites and 18.4 billion sessions to determine good, bad, and normal visitor shares across industries.
When only 20% of your visitors return to your site, you may find yourself wondering whether this is a good, bad, or neutral share, but without a way to know for sure. And since a healthy split varies by industry and traffic channel, it’s difficult to tell whether returning visitors engage with a site any differently from new ones.
We pulled new vs. returning visitor data from 410 properties, reconciled and consolidated the numbers, segmented it by industry and channel, and built the benchmark that’s been missing. Now, you can compare your return rate to similar sites instead of guessing whether your split is healthy.
- What Are “New” and “Returning” Visitors in GA4?
- What’s a Good New vs. Returning Visitor Split?
- Industry Benchmarks
- Channel Benchmarks
- Do Returning Visitors Engage More?
- How To Improve Returning-Visitor Share
- Turn Benchmarks Into Returning Traffic
- Methodology
- Frequently Asked Questions
What Are “New” and “Returning” Visitors in GA4?
GA4 splits every session into “new” and “returning” visitors:
- New visitors: The first session recorded for that device or browser.
- Returning visitors: Any session after the first on the same device or browser.
Since this classification is based on cookies, switching devices, or incognito browsing, it’s not a perfect count of unique humans. Repeat visitors can sometimes look “new” again, so we recommend treating it as a strong behavioral signal — not an exact head count.
We also recommend pairing this metric with bounce rate to describe the quality of a session from different angles.
New vs. returning visitors is not the same as new vs. returning customers. GA4’s dimension is about sessions on a device, not people or purchases. Keep this distinction in mind so you don’t read the numbers as a loyalty or retention metric.
What’s a Good New vs. Returning Visitor Split?
A typical site sees roughly 20% to 25% of sessions from returning visitors and 75% to 80% from new ones. If your site falls in this range, you’re right in line with the norm.
For example, across the 410 properties in our sample, the median returning-visitor share is 22.7%. However, our median returning-visitor share differs markedly from the session-weighted average of 55.2%.
| # of Properties* | Weighted | Median | |
|---|---|---|---|
| All Properties | 410 | 55.2% | 22.7% |
| Core Set | 387 | 44.2% | 22.2% |
*Our core set excludes 23 properties flagged for unusually high traffic volume, unclassified sessions, or an extreme new vs. returning skew.
Should you trust the median or the weighted average?
The median tells you what’s typical for a single site like yours. The weighted average tells you what’s typical per session across the whole sample, including massive, high-frequency-use properties. Use the median to benchmark your own site.
Benchmarks by Industry
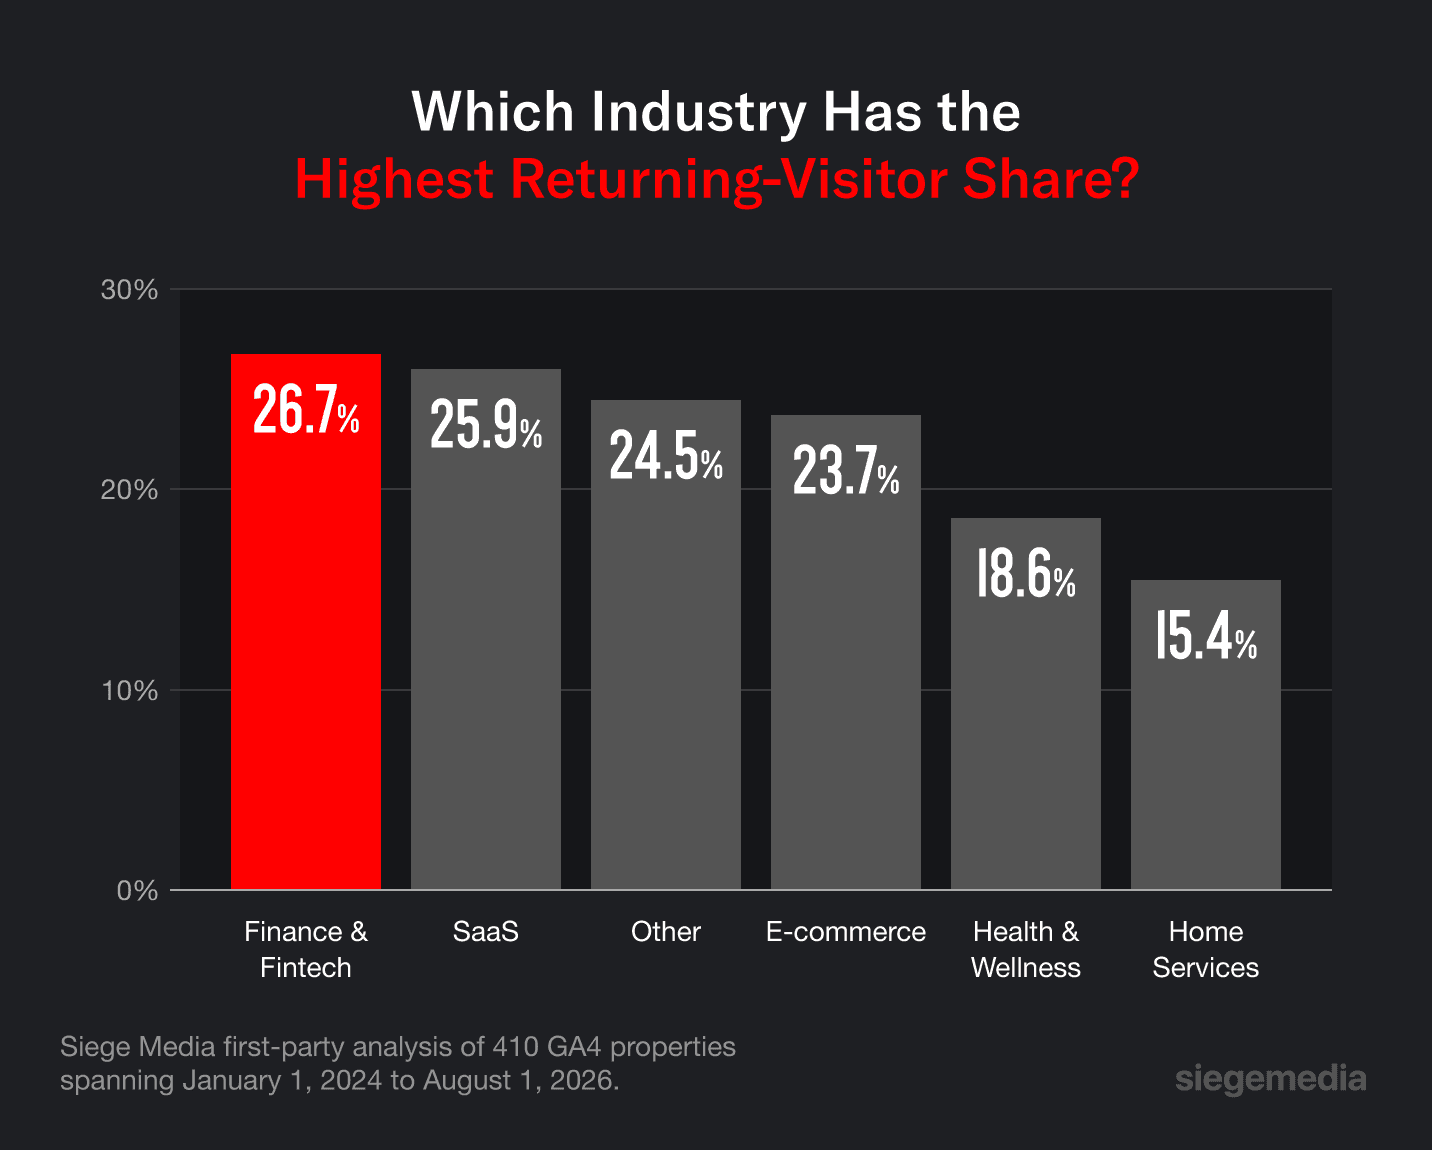
Comparing your new vs. returning visitor numbers to your industry benchmarks is the best way to determine if your split is healthy.
Note: Our “Other” category pools together 33 distinct brands from smaller verticals, including insurance, nonprofit, travel, media, and legal.
| Industry | Median Returning-Visitor Share |
|---|---|
| Finance & Fintech | 26.7% |
| SaaS | 25.9% |
| Other | 24.5% |
| E-commerce | 23.7% |
| Health & Wellness | 18.6% |
| Home Services | 15.4% |
Finance/fintech and SaaS/B2B software grab the top spots, which track as they both involve accounts people log back into repeatedly.
Home services sit at the bottom, staying consistent with a research-and-book-once buying pattern. When visitors have one job, like finding a plumber or getting a quote, they don’t need to come back once they’re done.
Benchmarks by Channel
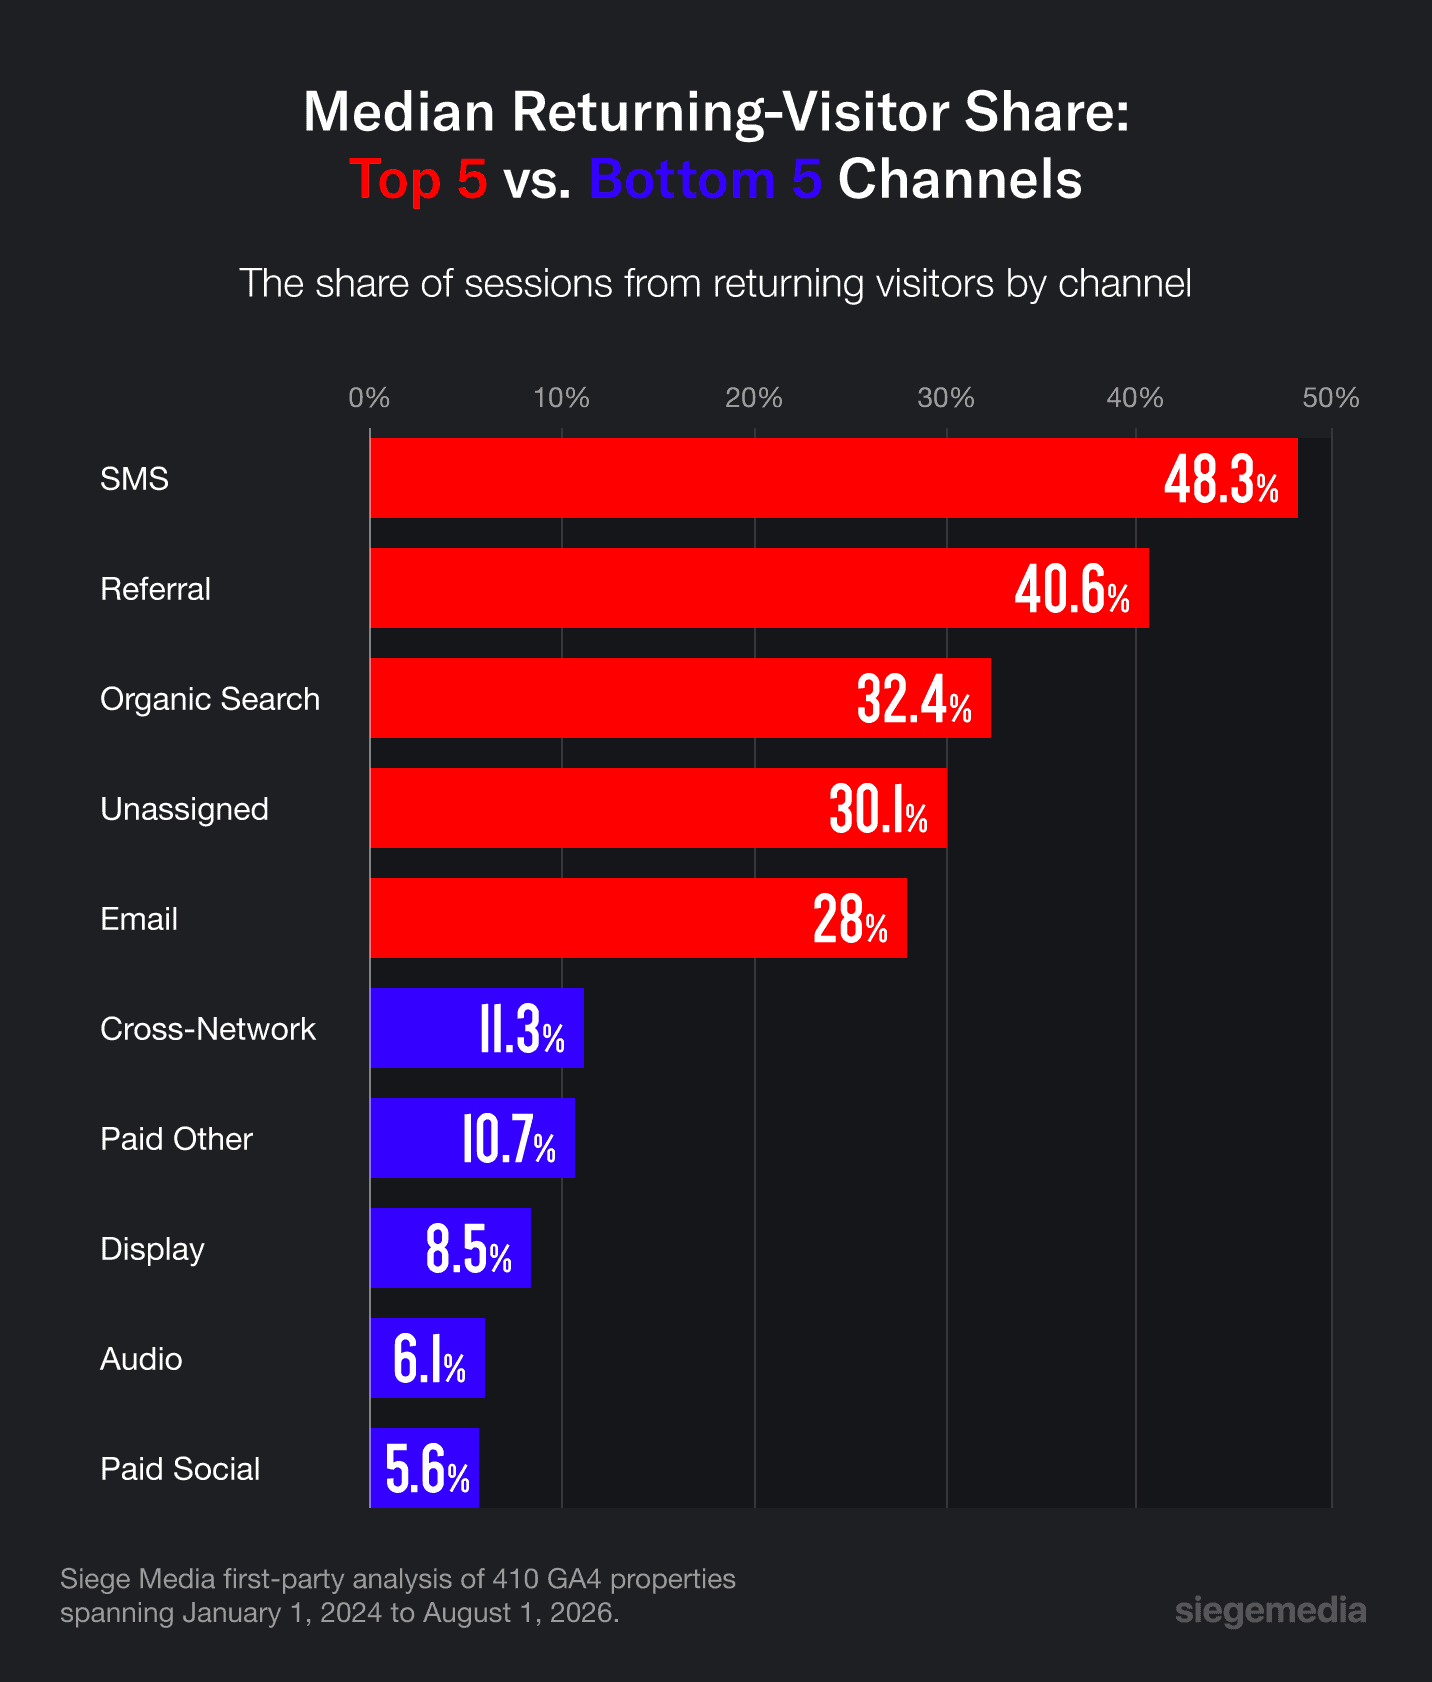
Channel benchmarks tell a more surprising story than the industry does, and the range is wider. The industry medians span just 11.3 percentage points, while the channel medians span 42.7 points, including opt-in and discovery channels.
| Channel | Median Returning-Visitor Share | Properties |
|---|---|---|
| SMS | 48.3% | 88 |
| Referral | 40.6% | 407 |
| Organic Search | 32.4% | 408 |
| Unassigned | 30.1% | 408 |
| 28% | 340 | |
| Organic Video | 23.6% | 288 |
| AI Assistant | 21.4% | 271 |
| Affiliates | 20.7% | 123 |
| Paid Shopping | 19.3% | 69 |
| Direct | 17.9% | 410 |
| Paid Search | 17.1% | 301 |
| Organic Shopping | 16.9% | 259 |
| Mobile Push Notifications | 14.3% | 55 |
| Paid Video | 12.9% | 109 |
| Organic Social | 12.3% | 391 |
| Cross-Network | 11.3% | 221 |
| Paid Other | 10.7% | 251 |
| Display | 8.5% | 204 |
| Audio | 6.1% | 25 |
| Paid Social | 5.6% | 243 |
SMS and referral channels come closest to an even split between new and returning visitors, at 48.3% and 40.6% respectively. The biggest surprise across the channel rankings is mobile push notifications. As an opt-in channel, these notifications are only sent to people who already know the brand, so you’d expect it to skew heavily toward returning visitors.
Instead, push notifications rank 13th out of the 20 channels we tracked, behind organic search, direct, and paid search. With these findings, you can read traffic from channels like organic search and AI Assistant as genuine engagement signals, since they don’t depend on already-acquired contacts the way SMS and email do.
Bonus Insight: Watch AI and Affiliate Channels
While opt-in and organic channels hold the lion’s share of returning traffic, it’s worth keeping your eye on the AI Assistant and Affiliate channels.
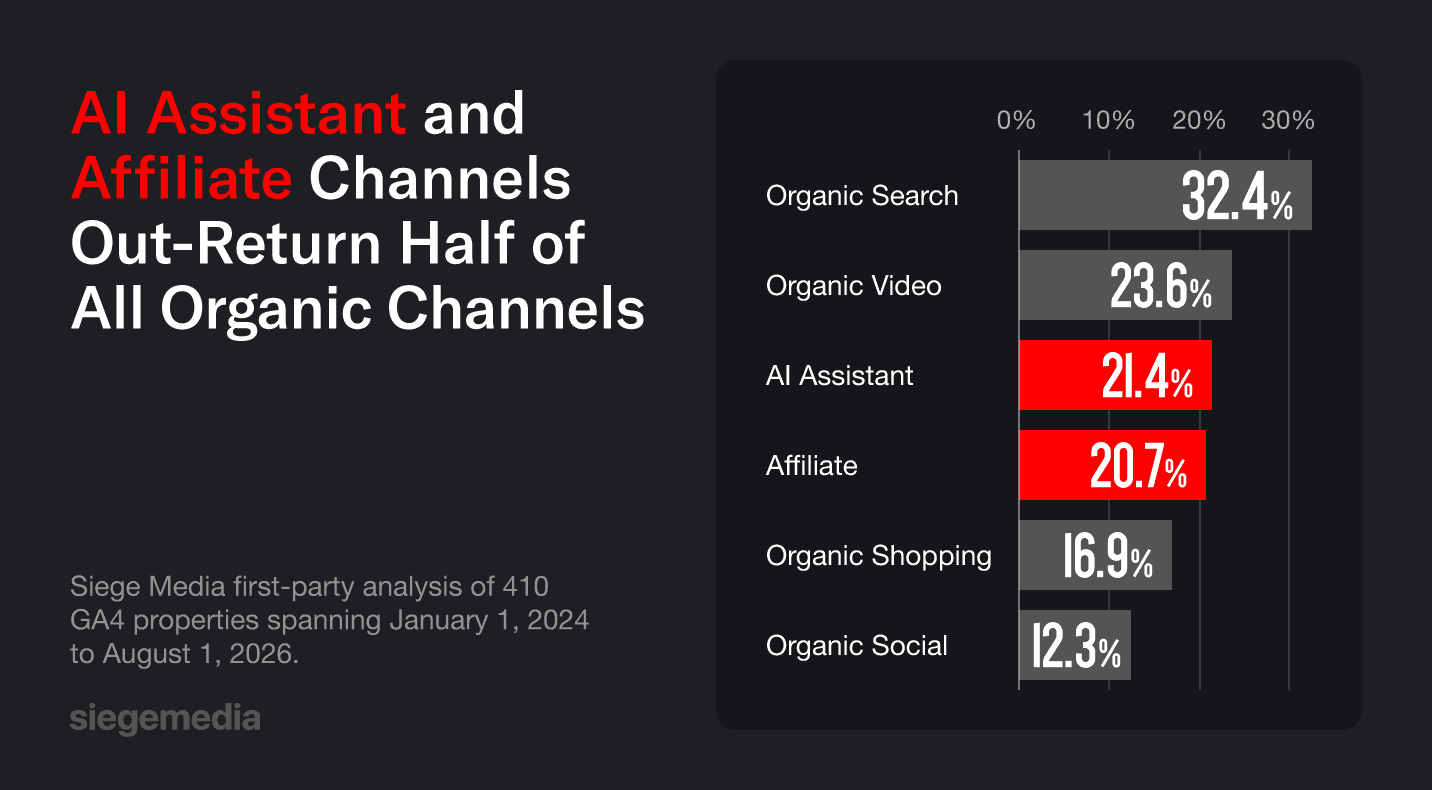
AI Assistant traffic referred from tools like ChatGPT and Perplexity has a returning-visitor share of 21.4%. This channel ranks in the upper half of those we tracked, well ahead of established channels like paid shopping (19.3%) and paid search (17.1%). For a channel this new, this is a notable, mature-looking split, reinforcing the pattern that LLMs drive engaged traffic (even with lower session counts).
“For a typical site in our data, about one in five AI Assistant sessions comes from a returning visitor. Paid search is closer to one in six. A lot of people are using LLMs to get back to sites they already know. That’s why I’d track AI as its own channel, since a good bit of it still gets filed under referral or direct.”
Jack Scherrer
Sr. Director, Analytics at Siege Media
The Affiliate channel’s share is 20.7%, just behind AI Assistant’s 21.4%. That’s a meaningfully higher return share from a channel many marketers typically associate with one-and-done referrals or coupon clicks.
With a competitive share of returning visitors, the data suggests that a well-run affiliate program can also build a base of returning, higher-intent visitors (instead of only bringing in first-time traffic).
Do Returning Visitors Engage More?
Returning visitors do engage more than new visitors, and the difference holds up whether you check the median or the weighted average.
| Segment | Weighted Engagement Rate | Median Engagement Rate |
|---|---|---|
| New Visitors | 63.9% | 53.3% |
| Returning Visitors | 77.8% | 58.4% |
Returning visitors posting a higher engagement rate lines up with intuition: A user who’s already visited your site has a better sense of what to expect and where to go. They’re more likely to stick around, view a second page, or trigger a key event.
How To Improve Returning-Visitor Share
To increase your number of return visitors, there are a few reliable tips and tricks you can use:
- Create guides, tools, proprietary data, and calculators that people bookmark and return to.
- Directly re-engage with your subscribers so they don’t have to rediscover you through search or social every time.
- Use internal linking to point visitors to a logical next page, keep them exploring, and increase interest in returning for related content.
- Consider paid retargeting to directly bring people who have already visited your page back to your site.
- Save user preferences or build personalized dashboards to turn browsing sessions into habits, if it’s right for your industry.
- Update your best-performing pages to give your visitors something new to browse (while improving freshness for LLM visibility, too).
There’s one caveat you should keep in mind, though. Improving your returning-visitor share isn’t always the right goal. A healthy split depends on your business model, and you should tailor your strategies to the best practices for your industry (not just what looks good on a page or graph).
Turn Benchmarks Into Returning Traffic
A healthy new vs. returning visitors split looks different for every business, but industry and channel benchmarks give you real data to check yourself against. If your site’s returning-visitor share is well below your industry’s median, that’s usually a sign that visitors aren’t finding a reason to come back.
If that’s the case, a deliberate strategy earns its keep with content built to surface on SERPs and LLMs and be revisited, not just clicked once from a search result. With a full-service GEO agency like Siege Media, you can build a strategy designed to earn returns.
Methodology
These benchmarks come from Siege Media’s own first-party analysis of 410 properties, each with at least 1,000 sessions spanning from January 1, 2024, to August 1, 2026. All 18.4 billion sessions are filtered by industry and channel, then aggregated and anonymized.
Our study reports the median rather than the session-weighted average since a handful of very high-traffic sites dominate the weighted number. Industry medians reflect each client’s share of returning visitors within that industry, excluding staging, test, internal properties, and properties with fewer than 1,000 sessions.
Frequently Asked Questions
What’s the Difference Between Active Users and Sessions?
The difference between active users and sessions is:
- Active users are the distinct people or devices that visited a site in a given period.
- Sessions are the total visits, including repeat visits, to a site in a given period.
One visitor who returns five times adds five sessions but only counts as one active user.
What’s the Difference Between Page Views and Visitors?
Pageviews count every page loaded, including multiple views by the same visitor within a single session. Visitors, or Users, count the distinct people behind those page views. Pageviews is almost always larger than visitors, because a single visitor can count for multiple views.
Is a High Returning-Visitor Percentage Good or Bad?
Whether a high percentage of returning visitors is good or bad depends on your business model. A high returning share is a strength for a SaaS product or membership site that depends on repeat use, but it can be a warning sign for a lead-gen or e-commerce site that needs a steady stream of new prospects to grow.