Infographics have fallen out of style a bit recently – much to do with Google saying they might devalue the tactic in months past. This has definitely led to a little less demand for the images, and a little more fear – will these infographics pass value in the future? Are they even passing value now?
These are real concerns, concerns I think about daily with my clients. How can I create the best strategy of creating infographics that adds value, but also doesn’t do so manipulatively or in a way that can potentially put their sites at risk in the future?
The answer, to me, is by:
- Allowing the person an easy way to post the infographic
- Giving them editorial control of how and where they link
- Also not losing the likelihood that they will link
The solution to this is creating an embed code that creates an essentially non-missable call to action to link above the infographic, without forcing the exact anchor text on the user. It also links directly on the image to an optimized page for marketing purposes, rather than direct to a .jpg or other image format.
The CTA above the image increases the likelihood they link above the infographic, improving CTR, branding, referrals and all that good stuff that should be associated with the infographics we create. It might even be worth more as a link, if the reasonable surfer is to be believed.
The direct link to the image creates a forced and natural link to the site, so even if they don’t listen to our ask to cite the original source, they’ll most likely do so with the infographic image anyways. The value of an image link is debatable, but if nothing else it allows the marketing engine to continue to hum as additional visitors can easily view and embed the image in its original form.
Better Infographic Embed Codes
So, for an example of said ideal embed code, let’s reference a random infographic from SEO-industry lovechild REI. If we saw this infographic embed box below the image hosted on the site:
Share this Image On Your Site
Please include attribution to REI.com with this graphic.
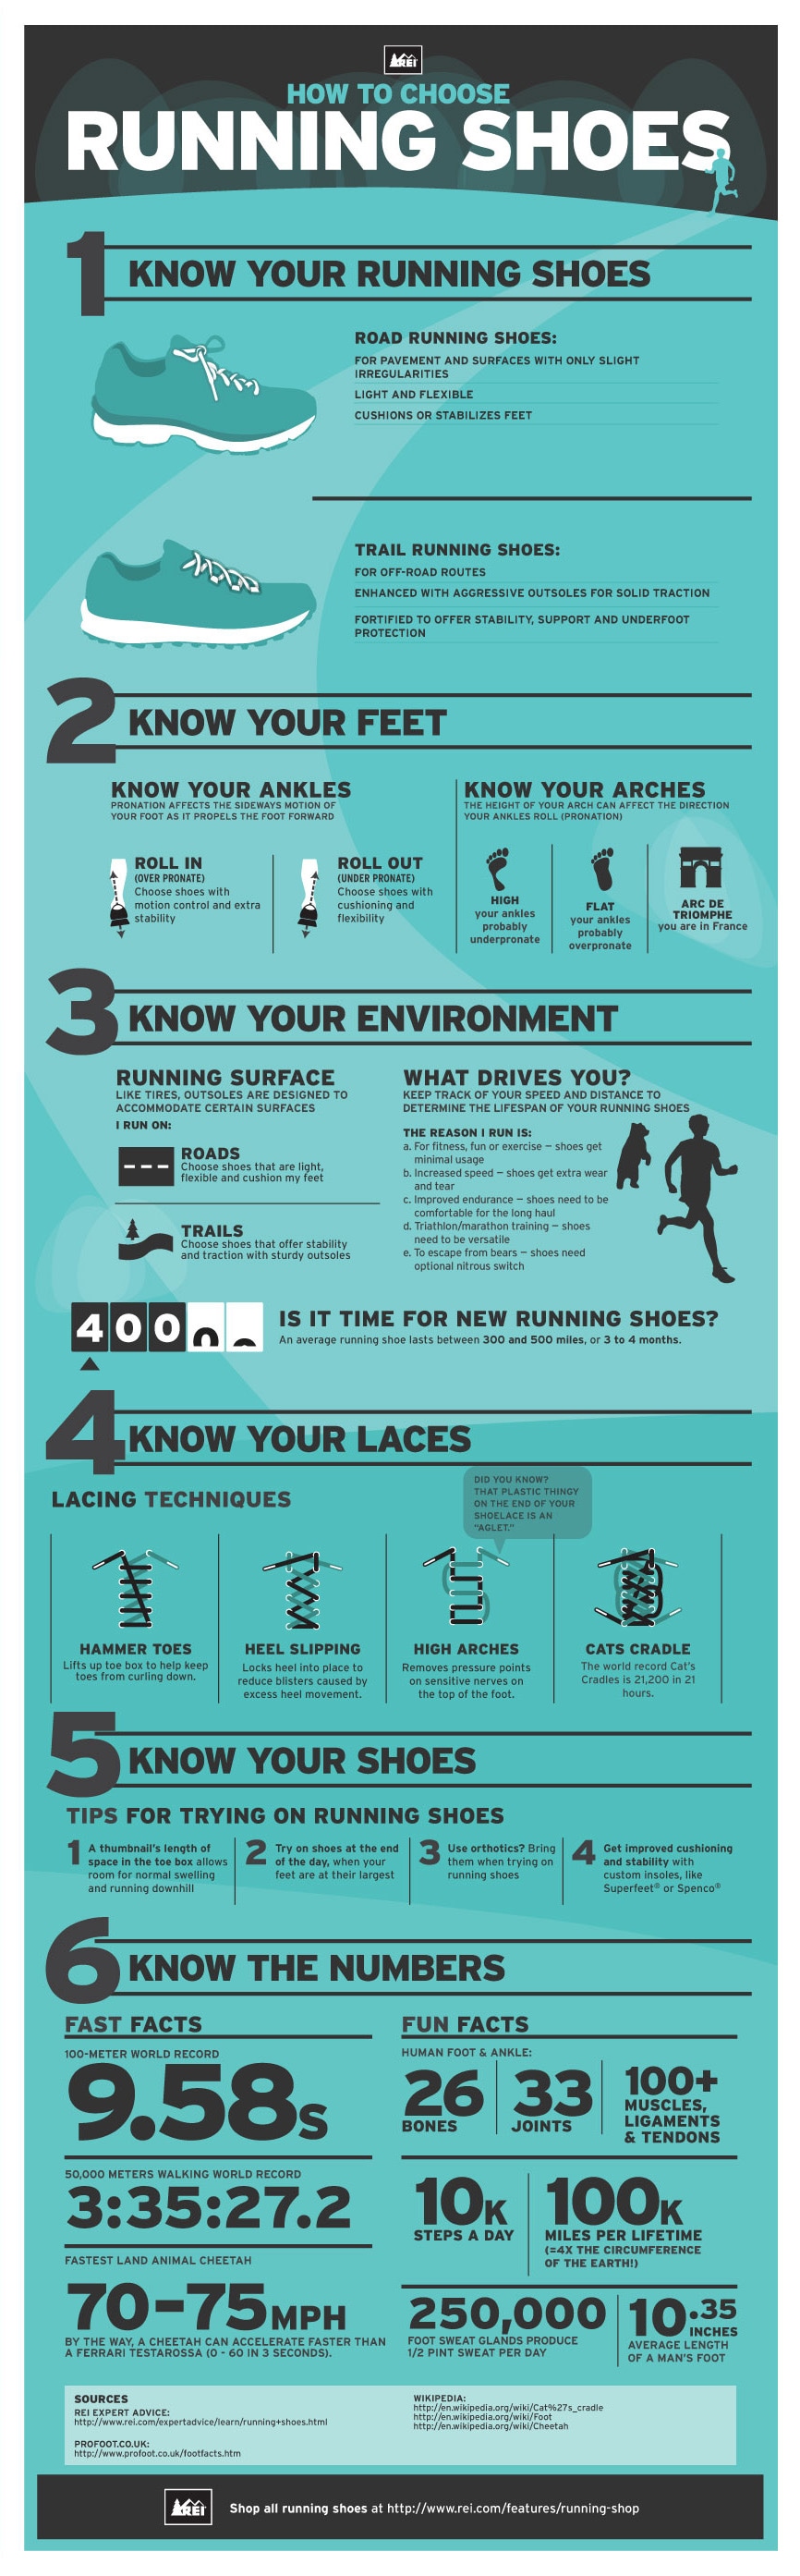
It would then appear as follows once a blogger copied and pasted the code on their site to reference the infographic.
Please include attribution to REI.com with this graphic.
Note the clear CTA above the image, imploring the blogger to properly cite the infographic – and also “nudging” them to do so in a way that will likely generate more clicks, embeds and etc (that is, above the image, not below it).
The company name is noted, so it’s obvious who created the image in the first place. A page with a full version of the hosted image is also still linked, which is the proper user experience, allowing users to easily find the highest resolution version, while also maintaining the direct link to a valuable page for marketing purposes.
Really, it’s the total package. We get a random link anchor text, we get a link a huge amount of the time, and we do it in a way that almost certainly can’t be devalued by Google – while also maximizing our brand impressions and clickthroughs.
A pretty solid strategy, I’d say.
(It should be mentioned as brought up by Jon Cooper below that the image hover “highlight” when you mouse over will not be how this image appears on most other sites – that’s just unique to Siege Media.)
Rules for Implementing This Strategy
It’s important to note that in this instance, you will want a full image of the infographic hosted on a built out page (not the .jpg file), such as with REI, so your link value is passed back properly, and people can also easily find the embed code/share buttons and etc when viewing the page.
The full image on the clickthrough is vital as well because if you don’t have a full image (only an abbreviated one), it’s a strange experience because people immediately expect to see the zoomed in version when clicking so they can easily read the infographic. In this case, REI does it right, and it wouldn’t break the experience.
If this infographic image above instead linked to a page like this from Travelstart, or this one from BuildDirect, you can see how that might greatly confuse viewers/lose some marketing power, as it would take them two clicks to get to a version where they didn’t have to squint.
More generally, this means that your full infographic should be hosted on its own unique page, not a blogpost with an image filename link, where it’s unlikely you can get ideal sizing.
Enter the Sustainable Embed Code Generator
Once this optimal strategy was found, I realized no tool really existed to create embed codes easily in this way. There had previously been plenty of good tools on the market to generate embed codes, but none to really do so in this exact method, which I believe is the correct way to do it moving forward.
So, I went out to get it made. Enter the Embed Code Generator.
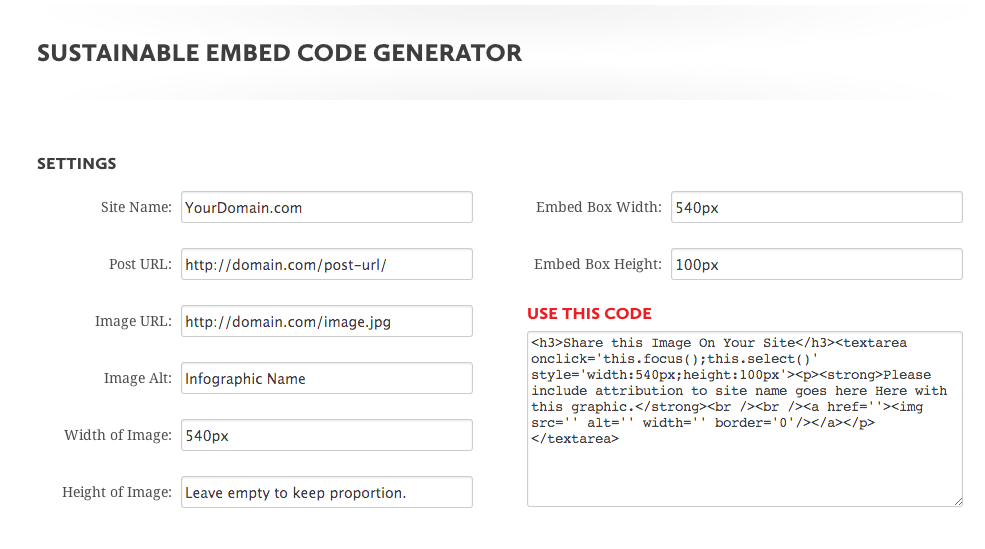
The embed code generator should be a straightforward tool for you to use while making landing pages for your infographics. Insert the data relevant to this kind of campaign, and then grab the “use this code” info on the right.
You’ll notice there is also a live preview of your embed code box below the tool. It should be noted that it won’t be centered or styled in the exact way this site does, but it should be helpful in determining your ideal proportions for the embed box.
Hopefully this tool can be useful for you/your designers/developers to create embed codes in an easier, more sustainable way. Also, please let me know if you have any feedback on the tool by contacting me. Thanks also go to Brandon Buttars of Avalaunch Media for helping build it.
Infographics in 2013 and Beyond
Infographics aren’t dead, and never will be – let’s just make sure we move forward building them as a marketing activity, not a purely SEO one. That way, we’ll get lots of value from them now and also far into the future.
For teams with lots of difficult to interpret, but also valuable data, they’re a go-to for sharing information, and shouldn’t be ignored. More than the fear of them getting devalued, I’m afraid of valuable marketing assets being hidden because of misinterpreted statment in a Matt Cutts interview. Infographics are still a really valuable tool for communicating data.