We analyzed 101 best “X” posts across 12 B2B websites and found a median engagement rate of 61.1% — well above the typical benchmark for informational content.
Whether elevating software options or industry-specific podcasts, best “X” are among the highest-intent pages a brand can build. And when a well-built one ranks and receives real traffic, the investment more than pays for itself.
We ran a study on our internal benchmark data, part of the same research series as our versus-pages analysis, this time focused on another core BOFU content type: best “X” posts across B2B brands.
Spanning financial software, HR/IT SaaS, communications SaaS, fintech, fleet tech, and more, here’s what a bottom-funnel (BOFU) content strategy actually says.
- Key Takeaways
- The Scene
- The Proof
- The Follow-Through
- The Pages-Per-Session Gap
- Build Best “X” Content That Converts
- Methodology and Caveats
Key Takeaways:
- The median engagement rate exceeds 61%, higher than the typical rate for informational content.
- 43% of posts in the dataset exceeded 65% engagement.
- The median session duration runs about 113 seconds.
- The site with the highest pages per session (2.73) got there through site structure, not better writing.
The Scene: Your Audience Shows Up Ready to Convert
Best “X” posts attract commercial-intent readers, so well-designed BOFU content strategies lead to engaged sessions where user attention is directed toward specific actions.
GA4 defines engaged sessions as those lasting longer than ten seconds, containing a conversion event, or including 2 or more page views. Across our 101 posts, the median engagement rate is 61.1%, with the top quartile exceeding 69% and the bottom quartile falling below 52%.
Best “X” readers aren’t skimming your posts. Instead, they’re actively engaging with your pages, comparing options, and gathering information before making a decision. The engagement distribution breaks it down further:
| Engagement Rate Range | Share of Dataset |
|---|---|
| 76%+ | 11% |
| 61-75% | 39% |
| 46-60% | 23% |
| 31-45% | 19% |
| Below 30% | 9% |
The posts with the highest engagement rates (61% or higher) share a common characteristic: tight product-market alignment.
These pages offer direct, relevant answers to the queries they target, and the engaged readers are the exact audience the content was built for. However, it must be said that engagement rate is partly a traffic-mix function, and it reflects who’s arriving as much as the content’s quality.
Important note: Despite our high engagement rate, the median bounce rate for our study of the best “X” posts was 38.9%.
The lowest bounce rates in the dataset were observed for posts with the tightest audience-to-content alignment. The highest bounce rates (above 70%) are associated with posts that have a clear mismatch between the traffic source and the content.
To reduce bounce rates, focus on audience-content alignment by building pages that genuinely satisfy the queries they target.
The Proof: Session Duration Is the Quality Signal
While engagement rates show your audience is ready to convert, session duration reveals which posts (and which on-page content) are built to last.
In our study, we found the median session on a best “X” post is about 113 seconds, with top posts exceeding 180 seconds. What separates the top from the bottom? Intentionally simplifying decision-making.
The most successful posts include:
- Deep comparison tables
- Transparent pricing context
- Same-page answers to follow-up questions
To understand what separates longer sessions from shorter ones, we looked at how session duration distributes across the full dataset:
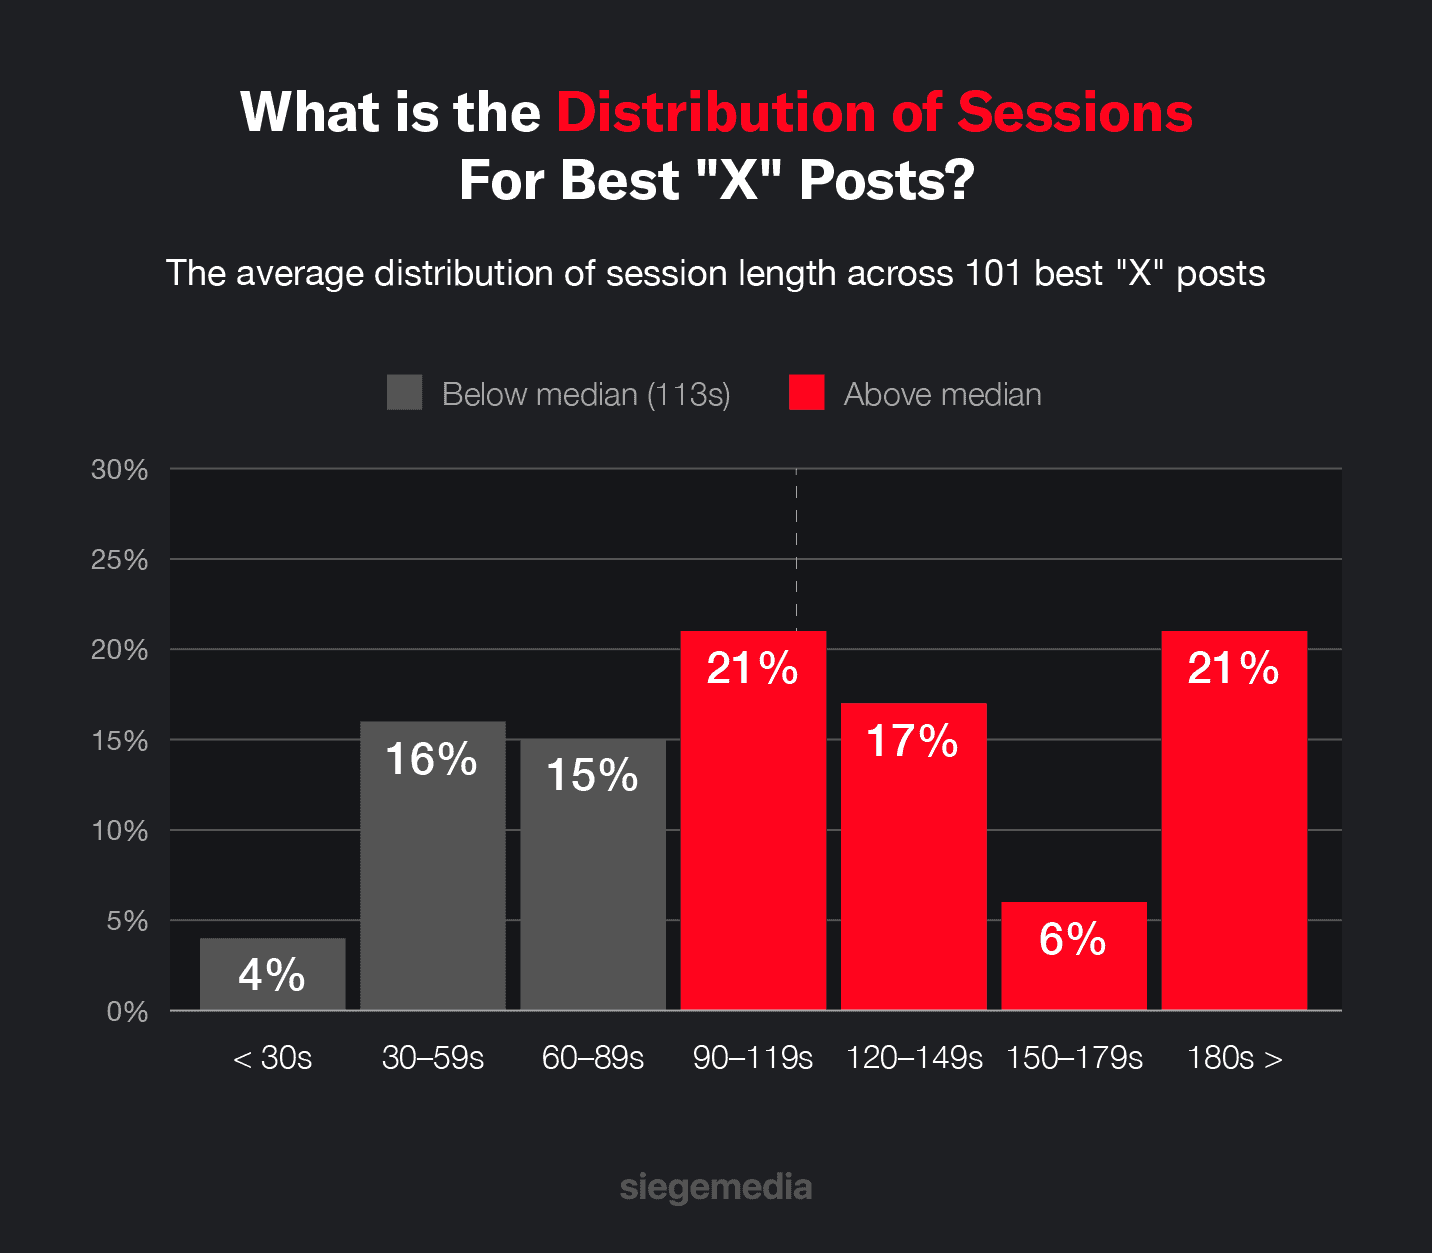
Our data shows an important split: Long sessions don’t always correlate with high engagement rates (though sometimes they do). Not every high-intent researcher will trigger a conversion event.
It’s clear, however, that both session duration and engagement rates matter and are complementary signals of a page’s quality. The better your editorial decisions are, the longer readers will stay on a page (giving them more time to choose you as their solution or to build brand awareness for a rainy day).
The Follow-Through: Scale Your BOFU Content
Our engagement rate data shows that best “X” content converts, but impression data shows why it’s worth the investment. Even at a modest click-through rate (CTR), high impression volume adds up.
Every time a potential buyer searches for “best [category]” and lands on your page, you gain brand awareness among those actively evaluating options. This form of organic visibility accumulates at no additional cost, and earning links over time or improving a page’s ranking may also increase CTR, compounding returns without additional spend.
Building product- and service-specific BOFU pages increases your visibility. And you get to choose the messaging your leads see, allowing you to personalize offerings, features, and more.
Important note: Posts in the top traffic tier (2,000+ sessions) showed a median engagement rate of roughly 65% and a median session duration of around 110 seconds. Posts in the bottom tier (fewer than 500 sessions) showed a median engagement rate of 57.6% and a median session duration of 85 seconds.
Posts that accumulated high organic traffic did so partly because they ranked for well-matched queries at strong positions. Posts with lower traffic are often newer, rank lower, or target queries with lower search demand.
The Pages-Per-Session Gap Is a Structural Problem
Across our dataset of 101 posts, the median pages per session was 1, indicating that the typical reader views exactly one page and then exits. In fact, 10 of our 12 site categories held at or below 1.08 pages/session.
However, the top-performing site category in our dataset averaged 2.73 pages per session, while the rest of the dataset held near or below 1.08. And while the content quality is comparable to other pages across our dataset, the difference is in the architecture, including:
- Deliberate in-body linking that creates natural paths from informational content to conversion pages
To fill this gap and drive conversions, connect your best “X” posts to adjacent service pages and related tools in your body copy. Focus on the structure of your page alongside its editorial content.
If your best “X” content shows pages per session under 1.1, you’re leaving conversion paths on the table.
What High Pages-Per-Session Architecture Looks Like
The sites that drive higher internal navigation rely on deliberate structural choices. In-body linking patterns should be consistently structured, similar to this example for a high-performing best “X” post:
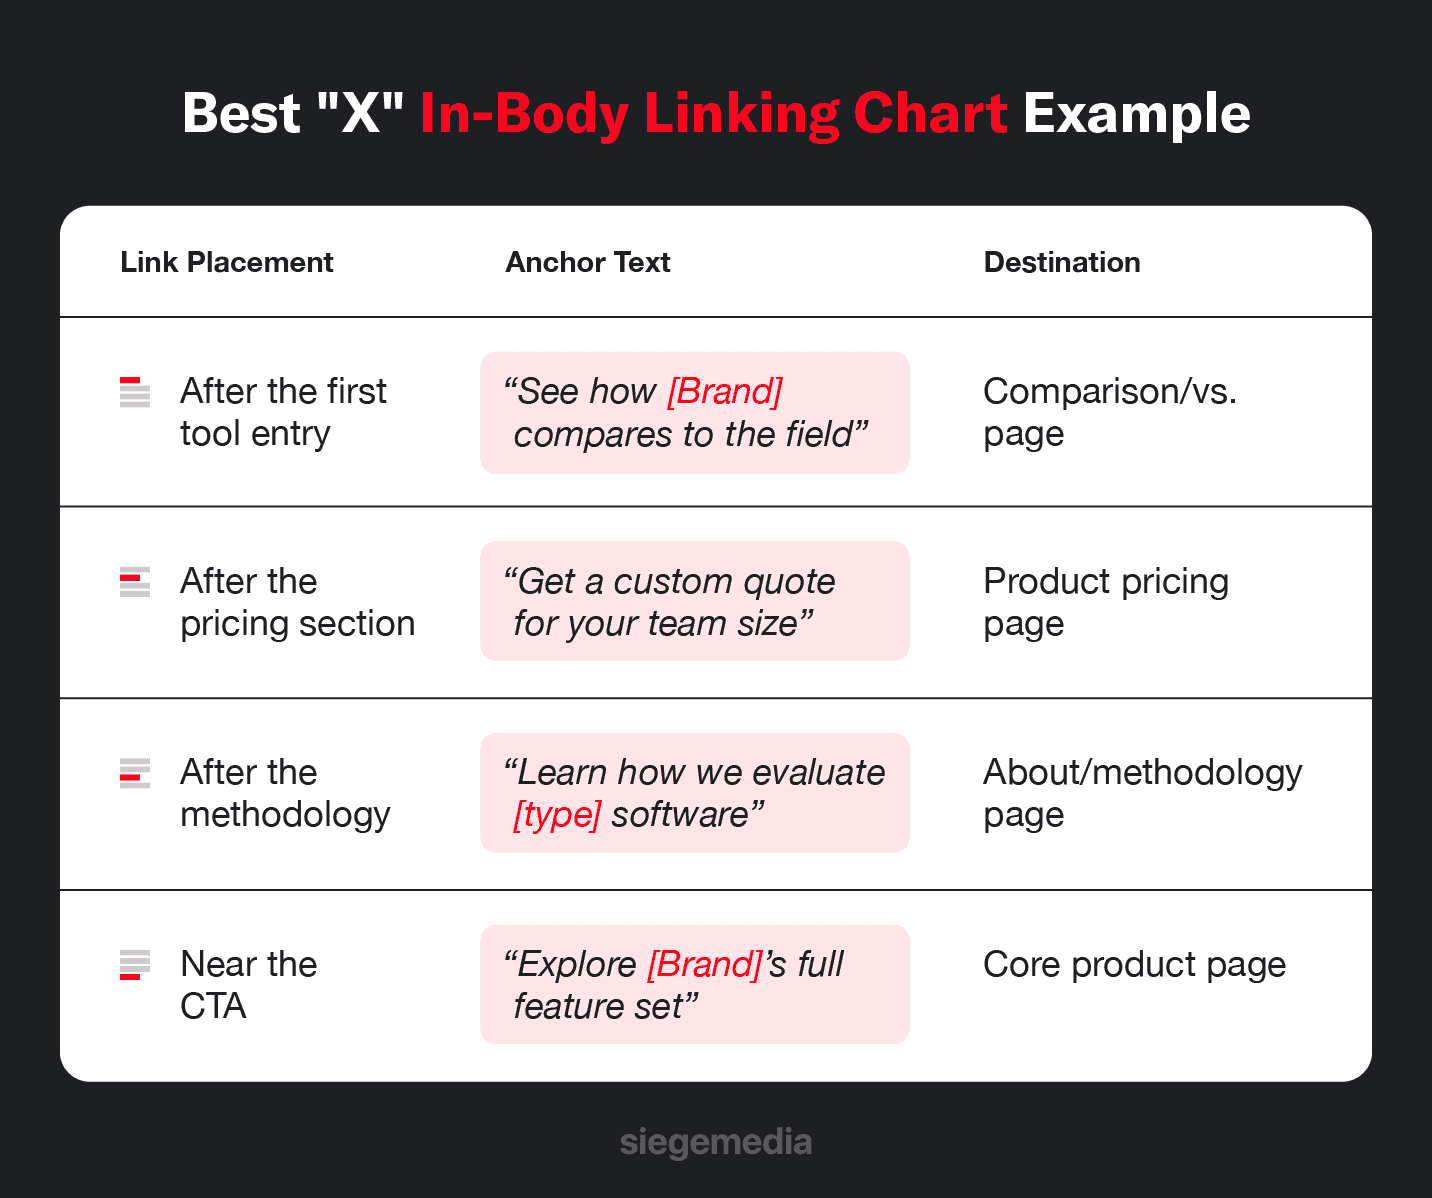
With this structure, each best “X” entry acts as a mini-conversion funnel where the reader evaluates, compares, and acts without leaving the domain.
Next, posts in our dataset with session durations above 150 seconds consistently use comparison tables to answer decision-stage questions. This example shows the important callouts to include to drive longer sessions:
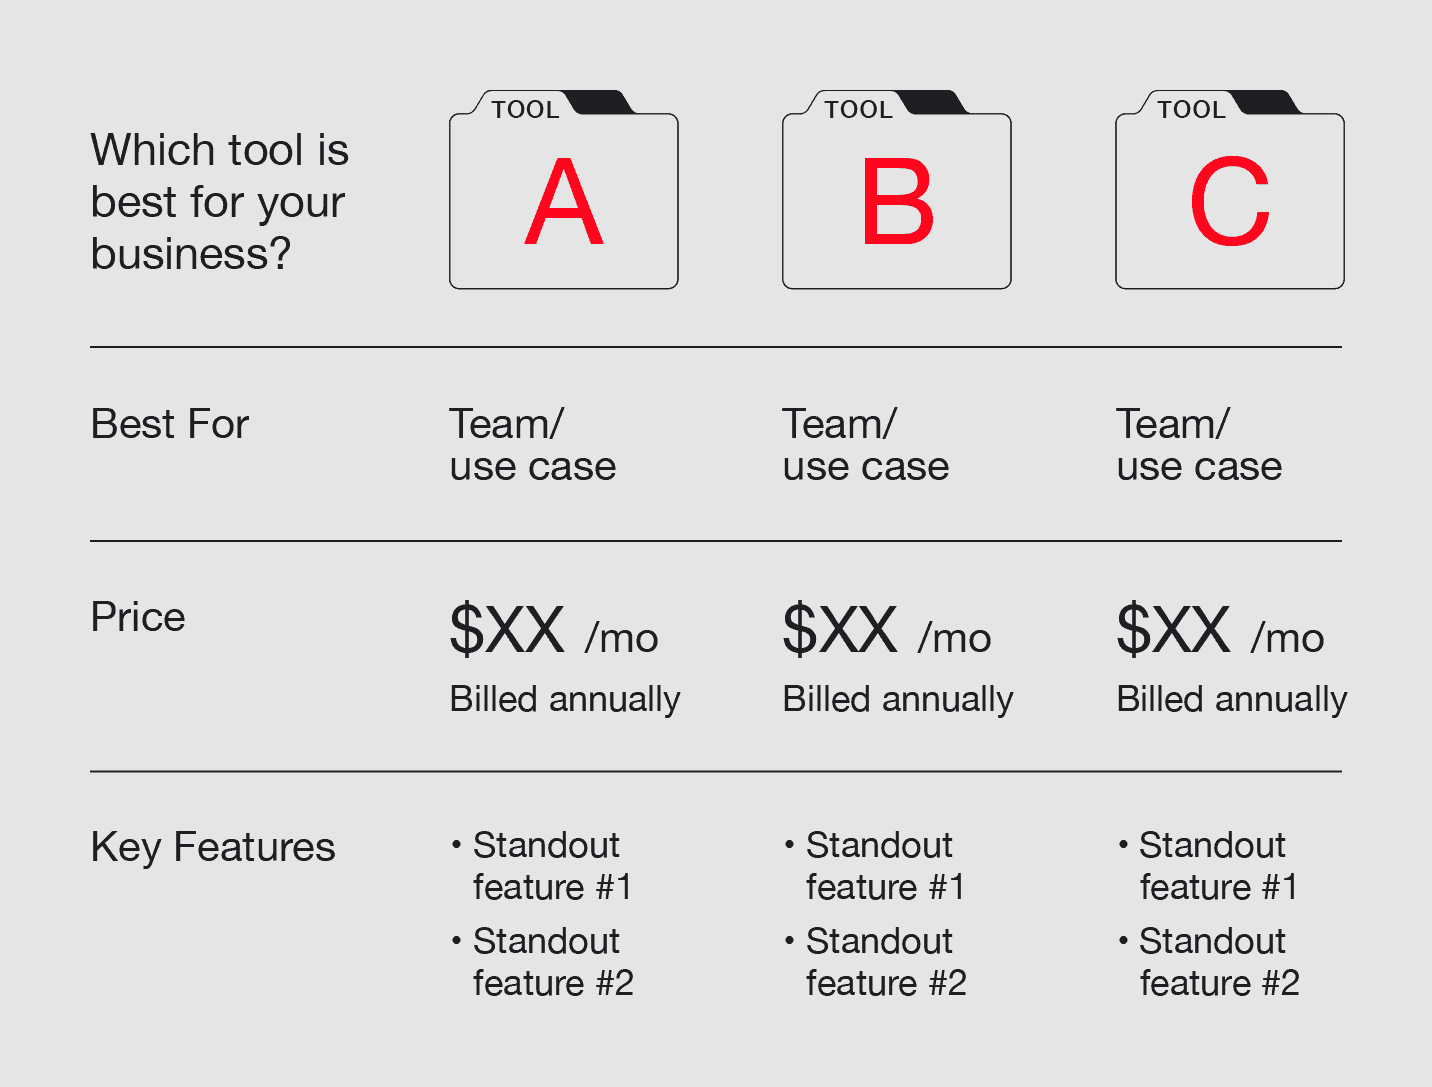
This format helps answer the implicit question (“which one is actually right for me?”) rather than just listing features. For best “X” posts, the “best for” callout carries the most decision weight and is also the column readers scroll back to most.
Build Best “X” Content That Actually Converts
Our best “X” data proves one thing: BOFU content moves the needle. To be successful, you need to:
- Be a true solution for your targeted queries.
- Opt for in-depth guidance via tables and explicit recommendations.
- Prioritize freshness and transparency in features or pricing.
- Build linking pathways between BOFU pages and products.
Your actual content accounts for only part of a successful strategy, while product-market alignment and brand authority determine the rest. If you’re building or scaling best “X” pages, Siege Media’s full-service GEO strategies produce results without the guesswork.
Partner with us today to build best “X” content for customer, SERP, and LLM visibility—and drive conversions while you’re at it.
Methodology and Caveats
Using the Google Analytics Data API, we sampled 101 B2B best “X” pages over the trailing 12 months from March 2025 to February 2026. These pages were selected from 12 websites, which constitute a meaningful but not exhaustive sample. The above data and recommendations should be treated as benchmarks, not absolutes.
We included pages whose titles matched a “best [category]” intent pattern and generated ≥50 sessions in the window. Categories could include:
- Software
- Tools
- Platform
- Service
- Apps
- System
- Provider
- Company
- Device
Pages covering “best practices,” “best ways to,” gated webinar pages, community Q&A, non-English URLs, product page taglines, and brand-named alternative posts were excluded. Where a URL appeared under multiple title tags due to mid-year updates, session-weighted averages were applied.