
Blogging isn’t going anywhere when it comes to content marketing strategies. These blogging statistics can help with your content strategy in 2025 and beyond.
As an SEO-focused content marketing agency with more than a decade in the game, we know a thing or two about how valuable blogging is for any content strategy that converts.
Blogging is considered a cornerstone of digital marketing, with content creators, businesses, and marketers leveraging blogs to connect with their audiences and drive engagement.
Whether you’re exploring business blog ideas to boost visibility, implementing on-page SEO to drive traffic (and conversions), or starting a personal lifestyle blog, it’s crucial to keep these blogging statistics in mind.
In this post, we’ll cover the top blogging statistics and dive into the metrics behind today’s most popular blogs. Use these insights to enhance your content strategy, both now and in the future.
- Top 10 Blogging Statistics
- Blog Traffic Statistics
- AI in Blogging Statistics
- Content Marketing Blogging Statistics
- Frequency and Engagement Statistics
- SEO and Guest Blogging Statistics
- Blog Revenue Statistics
- Blog Design and Visual Statistics
- Business Blog Statistics
- Kick-Start Your Content Strategy
Top 10 Blogging Statistics
Understanding the top blogging statistics helps you stay ahead of the curve, offering valuable insights into what’s working and what’s not.
These insights can help you refine your content, reach a broader audience, and drive more meaningful engagement.
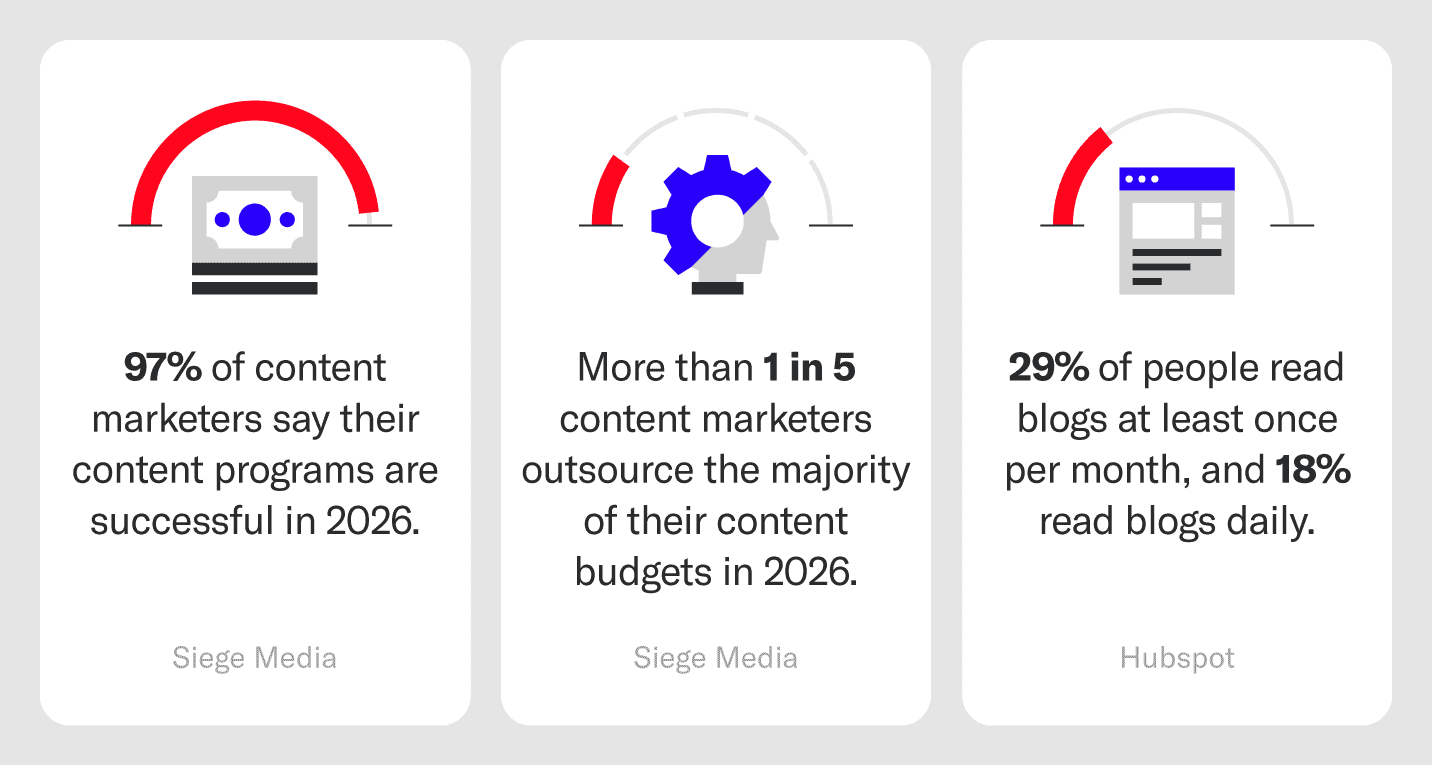
- 97% of content marketers say their content programs are successful in 2026, up from 73% in 2025. (Siege Media, 2026)
- More than 1 in 5 content marketers outsource the majority of their content budgets in 2026. (Siege Media, 2026)
- 97% of content marketers plan to use AI to support content marketing efforts in 2026, up from 90% in 2025, 83.2% in 2024, and 64.7% in 2023. (Siege Media, 2026)
- But fewer content marketers (44%) use AI to draft content now than in 2025 (57%). (Siege Media, 2026)
- 29% of people in a HubSpot survey read blogs at least once per month, and 18% read blogs daily. (HubSpot, 2023)
- 49% of content marketers create content based on original research. (Orbit Media, 2025)
- 39% of bloggers who write 2,000 or more words per post also report “strong results.” (Orbit Media, 2025)
- Blogs across industries saw engagement improvements (+35 points) in 2025. (Siege Media, 2025)
- 38% of bloggers who report strong results use more than one editor before publishing, compared to 34% who use just one. (Statista, 2023)
- Blogs are a key lead-generation tool, with 76% of content marketers relying on them. (Demandsage, 2025)
Blog Traffic Statistics
How often do internet users actually visit blog pages? More than you might think! With the right strategy, blogs can be a powerful tool to get your content in front of a wider audience.
If you’re looking to increase website traffic, focusing on SEO, compelling headlines, and quality content can turn those casual visitors into regular readers.
- B2B and SaaS show sharp recent traffic declines, losing 58-62% of their traffic on average. (Siege Media, 2026)
- News was one of the hardest hit categories in 2025, with 37 of the top 50 U.S.-based news sites experiencing traffic declines. (Digital Bloom, 2025)
- Only 21% of bloggers report “strong results,” down from 30% five years ago. 60% report “some results.” (Orbit Media, 2025)
- Large language models are driving reductions in overall website traffic, but increases in homepage traffic. (Siege Media, 2025)
- “Attracting visitors from search” was the biggest blogging challenge in 2025. (Orbit Media, 2025)
- In January 2026, WordPress blogs collectively had over 14 billion page views. (WordPress, 2026)
- The average blog bounce rate is 82.4%. (Siege Media, 2024)
AI in Blogging Statistics
AI is quickly becoming a game-changer in the world of blogging, and the stats prove it. So, are you ready to harness the power of AI blog writing in your strategy?
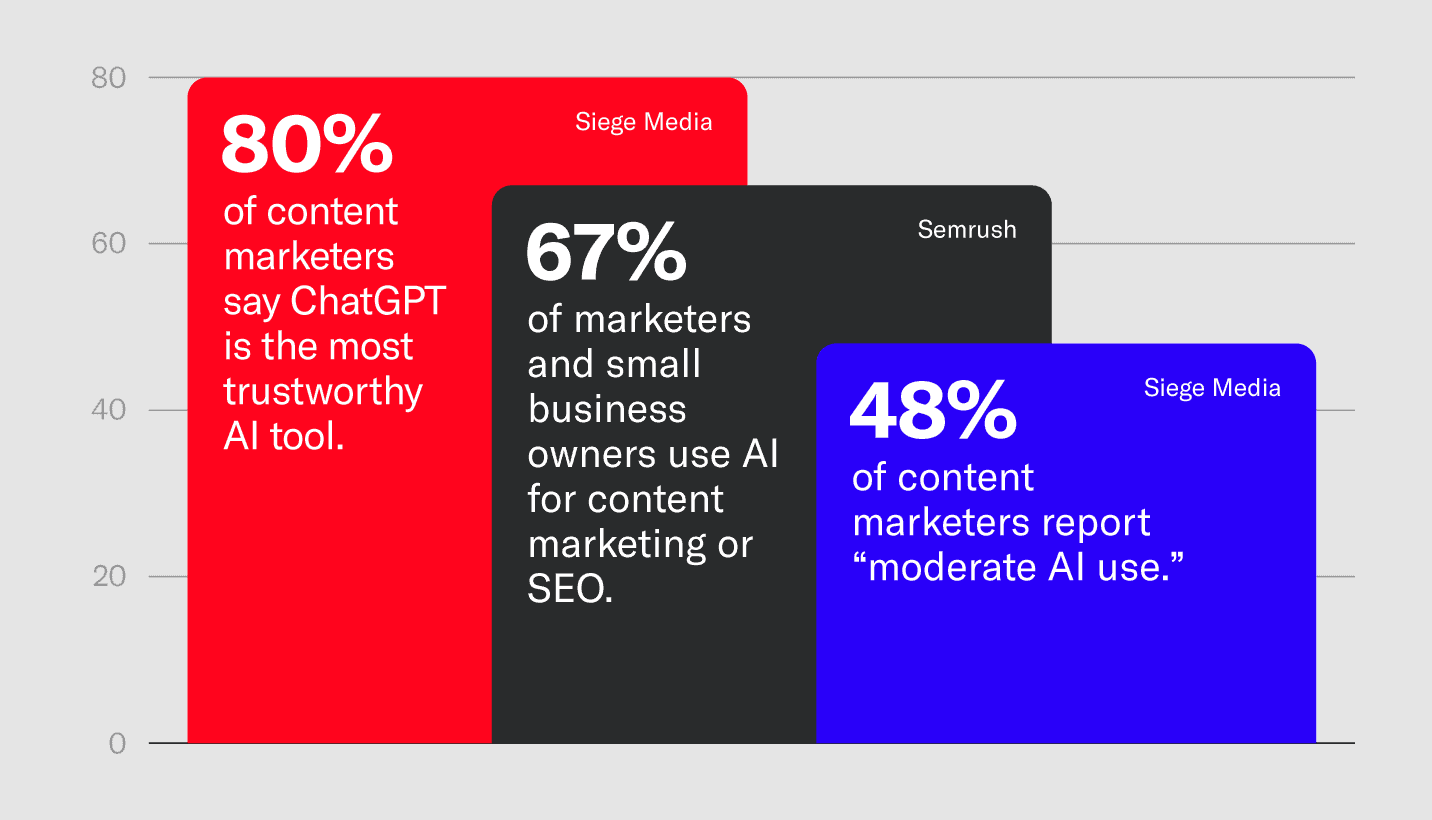
- 48% of content marketers report “moderate AI use,” meaning that AI touches between 11% and 40% of their work. (Siege Media, 2026.
- Only 1% of content marketers automate 100% of their efforts with AI. (Siege Media, 2026)
- 80% of content marketers trust ChatGPT the most among AI tools. (Siege Media, 2026)
- However, other tools are gaining ground. 55% of content marketers also rated Claude as trustworthy in 2026, up from 28% the year before. (Siege Media, 2026)
- In 2026, 61% of content marketers use AI for outlining, 74% for content ideation, and 44% for drafting content. (Siege Media, 2026)
- In a 50-site study, homepage clicks increased by 29.6% following the rollout of AI search overviews, suggesting a positive shift in high-value traffic despite broader declines. (Siege Media, 2025)
- 67% of marketers and small business owners use AI for content marketing or SEO. (Semrush, 2024)
- 47% of marketers have a clear understanding of how to use AI in their marketing strategy. (HubSpot, 2025)
- 47% of marketers understand how to measure the impact of AI in their marketing strategy. (HubSpot, 2025)
- 39% of marketers say it takes about two to three months for AI-generated content to rank. (Semrush, 2024)
- 49% of content marketers spend between $100 and $500 on LLM measurement tools each month. (Siege Media, 2026)
- 53.2% of articles shared on X are fully human-written, while 23.9% are fully AI-generated and 22.9% are a mix of AI and human writing. (Pangram, 2025)
- 93.04% of news articles published in a single day are still human-written, even as AI content becomes more prevalent. (Pangram, 2024)
Content Marketing Blogging Statistics
Content marketing continues to dominate the digital space, and blogging plays a key role in that success. Understanding the impact of your content strategy is important, especially when you realize there are content marketing benefits you simply can’t ignore.
- 12% of businesses plan to invest over $45,000 per month in content marketing in 2025, up from 4.1% in 2024. (Siege Media, 2026)
- Nearly 1 in 6 content marketers handle yearly budgets of over $500,000 (Siege Media, 2026)
- More than half of content marketers work with budgets under $15,000 (Siege Media, 2026)
- But the percentage of businesses spending less than $5,000 per month on content marketing has nearly halved since 2023, from 48% to 25%. (Siege Media, 2026)
- The average blog post is around 1,333 words, and only 9% of bloggers regularly write 2,000+ words. (Orbit Media, 2025)
- Bloggers who write 2,000+ words on average are far more likely to report strong results. (Orbit Media, 2025)
- Data suggests that bi-weekly posting is the minimum for content performance. (Orbit Media, 2025)
- When it comes to the type of content bloggers publish, how-to articles are the most popular (76%). (Orbit Media, 2025)
- 35% of readers skim blog posts, while 38% engage with them in-depth. (HubSpot, 2023)
Blogging Frequency and Engagement Statistics
How often should you post blogs, and what types of posts are the most popular? The answer lies in understanding the frequency and engagement patterns that drive results.
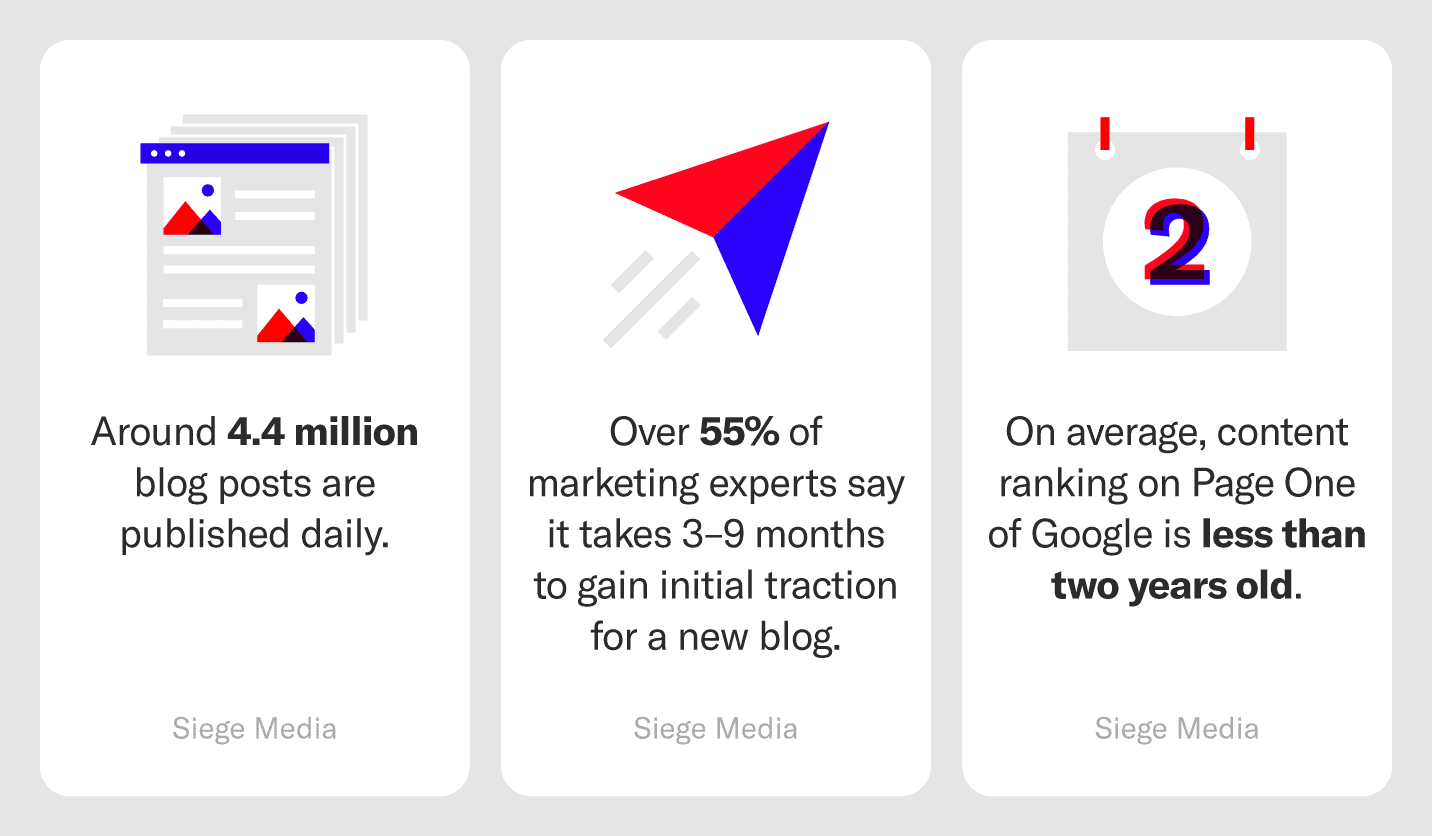
- Around 4.4 million blog posts are published daily, which translates to over 1.6 billion posts each year. (Siege Media, 2025)
- On average, content ranking on page one of Google is less than two years old, emphasizing the importance of updating content. (Siege Media, 2025)
- WordPress users alone produce 70 million new posts each month. (WordPress, 2025)
- If your blog is under a year old, aim to publish six to eight posts per month around key topic clusters aligned with your brand. (HubSpot, 2024)
- For complicated niches requiring more in-depth research, prioritize quality over quantity, aiming for two to four posts per month. (HubSpot, 2024)
- Over 55% of marketing experts say it takes 3–9 months to gain initial traction for a new blog, and significant traction can take over a year. (Siege Media, 2025)
- 29% of internet users read blogs one to four times a month, 18% read them daily, and 17% never read blogs. (HubSpot, 2023)
- On average, blog posts written by humans draw over 3x more traffic than their AI-generated counterparts. (NP Digital, 2024)
SEO and Guest Blogging Statistics
SEO writing and guest blogging are essential for boosting your blog’s reach and performance. These strategies improve search rankings and bring in valuable links, helping you attract more traffic.
- Nearly 60% of all U.S. Google searches are “zero-click,” meaning users either end their session without clicking any results or immediately search for another query. (Siege Media, 2025)
- Real estate and e-commerce blogs drive the most links to their websites, with real estate leading at 14.4 links per 10k visits. (Siege Media, 2026)
- The most successful brands at acquiring links leverage first-party / owned data to lead the industry. (Siege Media, 2026)
- An analysis of 912 million blog posts found that 94% of content lacks links. (Backlinko, 2025)
Blog Revenue Statistics
Starting a blog is the first step, but how can it actually generate revenue? Understanding content marketing ROI is key to turning your blog efforts into profit.
- Among marketing and media leaders, around 59% identified retaining and expanding existing customers as the most impactful content measure driving their organizations’ revenues. (Statista, 2024)
- On average, bloggers earn around $45,000, with most making between $38,440 and $51,906. (Ryan Robinson, 2024)
- 73% of B2B marketers consider content marketing the most effective strategy for generating leads and sales. (Fireword, 2025)
- Businesses that consistently blog experience 13x higher positive ROI compared to those that don’t. (Fireword, 2025)
- For B2B companies, content marketing, particularly through blogs and white papers, provides the highest return on investment. (Fireword, 2025)
- With marketing budgets shrinking, 83% of marketing leaders now view proving ROI as their top priority. (Fireword, 2025)
- Companies that leverage advanced analytics see a 5%-8% higher marketing ROI compared to their competitors. (Fireword, 2025)
Blog Design and Visual Statistics
Blog content design greatly impacts how readers engage with your content. From the images you use to the layout of your posts, the right visuals can make your blog more appealing and keep visitors coming back.
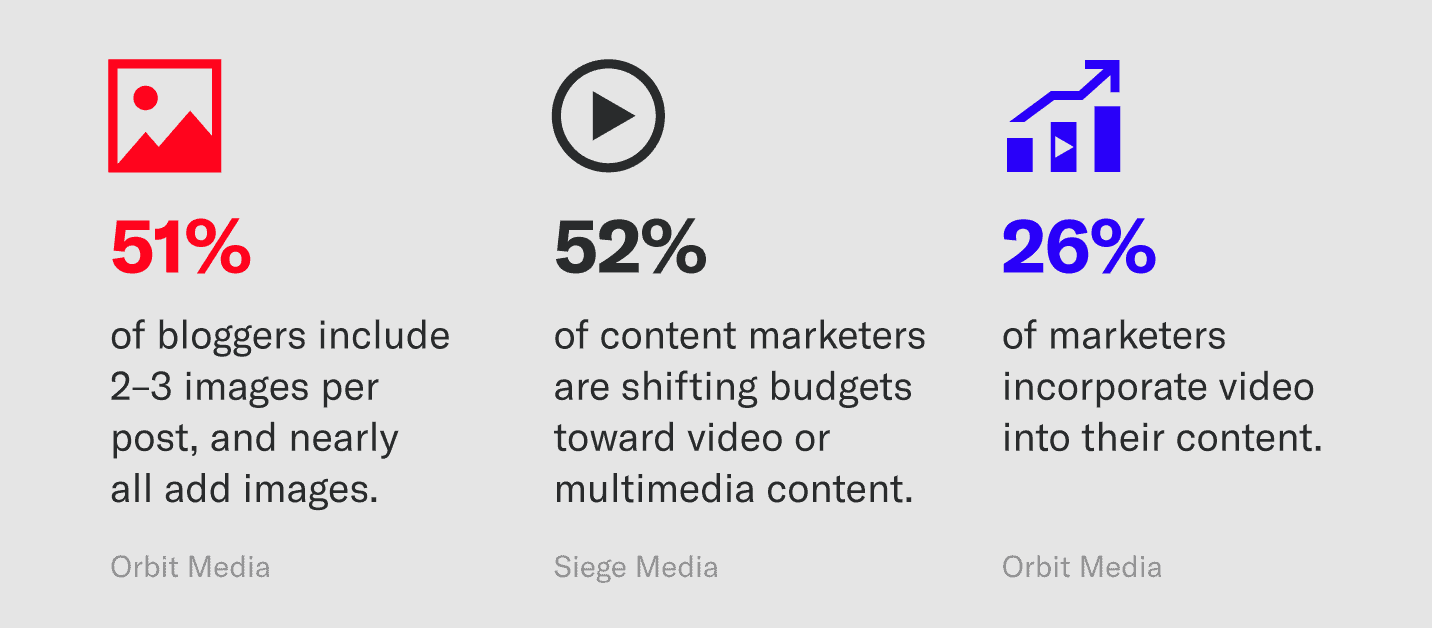
- Over half (52%) of content marketers are shifting their budgets toward video or multimedia content in 2026. (Siege Media, 2026)
- 39% of content marketers are shifting spending away from long-form content, with 36% shifting budget toward it. (Siege Media, 2026)
- 33% of content marketers are shifting budget away from interactive content, and 34% are moving budget toward it. (Siege Media, 2025)
- Visual storytelling is overtaking text-heavy content formats, with 21% of marketers citing short-form video and 19% citing images as delivering the highest ROI. Marketers plan to invest more in these channels in 2025. (HubSpot, 2025)
- When it comes to visuals, 26% of marketers incorporate video into their content. (Orbit Media, 2025)
- Almost every blogger adds images to their posts, and 51% include two to three images. (Orbit Media, 2025)
- Key elements driving blog results include audio (30%) and video (28%). (Orbit Media, 2025)
Business Blog Statistics
Business blogs aren’t just for sharing updates — they’re a powerful tool for building authority and driving growth. When done right, they can turn your website into a lead-generating machine.
- Guides, playbooks, and comparisons have the highest traffic share among industry and business blogs. (Siege Media, 2026)
- Although guides and playbooks still drive high traffic, their share of traffic is declining. Over the last two years, guides and playbooks lost 7 percentage points of traffic share. (Siege Media, 2026)
- Top-funnel content is losing ground across the board, with “how to” and tutorial posts losing 8 points in traffic share over the last two years. (Siege Media, 2026)
- Pricing type content (price comparisons) grew in traffic share by 12.1 percentage points during the previous two years. (Siege Media, 2026)
- The global content marketing market was valued at $413.2 billion in 2022 and is projected to reach $2 trillion by 2032, a CAGR of 16.9%. (Allied Market Research, 2023)
- 76% of B2C marketers used blogs to distribute content in the past 12 months, making it the second most popular distribution channel after organic social media. (Content Marketing Institute, 2023)
- For B2B brands, the top marketing channels for ROI in 2024 were website, blog, and SEO. (HubSpot, 2025)
- 72% of B2B customers engage with at least three pieces of content before contacting a salesperson. (Demand Gen Report, 2022)
- 84% of B2B marketers use blogs on corporate websites, while 71% use email newsletters. (Content Marketing Institute, 2025)
Kick-Start Your Content Strategy Today
Now that you have top blogging statistics at your fingertips, you can incorporate them into your content strategy.
Need help implementing a built-out content strategy? Siege Media is here to help you create content that is proven to drive prospects to your website and increase your blog’s ROI. Learn more about our content marketing services.